| Fire incidents reported |
|---|
| Sreet name | Count |
|---|
| 5TH AVE | 4 | | 860 GREENHAVEN ST | 4 | | GREENWOOD RD | 4 | | HIGHWAY 53 FWY | 4 | | HWY 53 | 4 | | NANCY LAKE RD | 4 | | 1 SNACKFOOD LANE | 2 | | 100 MAIN ST | 2 | | 1010 HOKAH | 2 | | 1030 HOKAH ST | 2 | | 12871 GREENWOOD RD | 2 | | 148 SOUTH LIMITS RD | 2 | | 181 2ND AVENUE | 2 | | 2 ND STREET ST | 2 | | 400 DENNINGER DR | 2 | | 402 RAILROAD ST | 2 | | 405 1ST ST | 2 | | 413 2ND STREET | 2 | | 6538 CROCKET | 2 | | 709 PINE ST | 2 | | 801 PINE ST | 2 | | 808 GREENHAVEN ST | 2 | | 851 BUSINESS HWY 53 | 2 | | B ST | 2 | | BALD EAGLE DRIVE DR | 2 |
| | | Fire incidents reported |
|---|
| Sreet name | Count |
|---|
| BEAR TRACK ROAD RD | 2 | | BEAR TREE RD | 2 | | BUSINESS HWY 53 | 2 | | COUNTY HWY F HWY | 2 | | CTY HWY K | 2 | | FLOWAGE RD | 2 | | FLOWAGE RD | 2 | | GILMORE DR | 2 | | GREENWOOD | 2 | | GREENWOOD ROAD | 2 | | HIGHWAY 77 HWY | 2 | | HOKAH STREET ST | 2 | | KAPPUS DR | 2 | | KAPPUS RD | 2 | | KIMBALL LAKE RD | 2 | | MASSETT DRIVE DR | 2 | | MCGREGOR ROAD RD | 2 | | MILES LAKE RD | 2 | | N12166 HWY 53 | 2 | | N12868 THREE MILE RD | 2 | | N12962 GILMORE DR | 2 | | N12993 GILMORE DR | 2 | | N13008 GREENWOOD RD | 2 | | N13079 GILMORE DR | 2 | | |
|
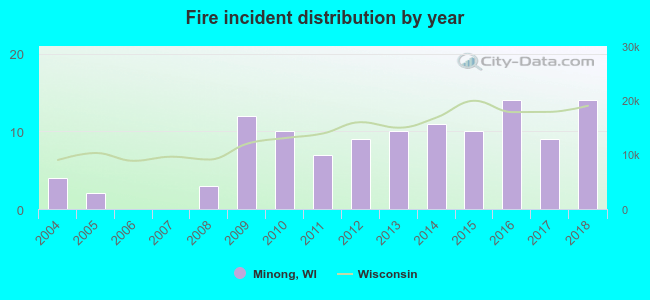 According to the data from the years 2004 - 2018 the average number of fire incidents per year is 8. The highest number of fire incidents - 14 took place in 2016, and the least - 0 in 2006. The data has a growing trend.
 27.8% incidents where reported in the morning and 72.2% in the evening. The most fires (19.1%) took place on Sunday, and the least (7.0%) on Monday.
 According to the 115 fires from years 2004 - 2018 most fires (14.8%) took place during May, and the least (1.7%) in February.
 Out of all 285 cases reported during the years 2004 - 2018, the most belonged to the categories: Fire (40.4%), Overpressure Rupture (33.7%), and Rescue & EMS (14.0%).
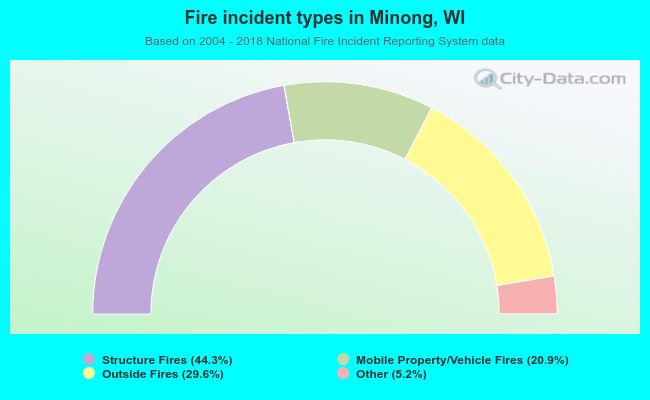 When looking into fire subcategories, the most reports belonged to: Structure Fires (44.3%), and Outside Fires (29.6%).