| Fire incidents reported |
|---|
| Sreet name | Count |
|---|
| HIGHWAY 18 | 12 | | HWY 18 | 10 | | HWY 18 W | 8 | | WHITEHORSE | 8 | | 2ND ST | 6 | | ELSIE ST | 6 | | HWY 83 S | 6 | | MARGE LN | 6 | | TAFT ST | 6 | | TURTLE DAM | 6 | | HWY 83 N | 4 | | N DUMP ROAD | 4 | | NORTH BUTTE | 4 | | OLD RING THUNDER ROAD | 4 | | SUNRISE | 4 | | US HIGHWAY 83 | 4 | | 2 MILES W ROSEBUD CUT ACROSS | 2 | | 3601 RED DRIVE | 2 | | 3RD AVE | 2 | | 3RD ST | 2 | | 3RD ST | 2 | | 5 MILES NORTH OF MISSION | 2 | | ADAM ST | 2 | | BEHIND BOYS AND GIRL CLUB | 2 | | BIA ROUTE 7 MORAN RESIDENCE | 2 |
| | | Fire incidents reported |
|---|
| Sreet name | Count |
|---|
| BY STATE YARD | 2 | | CITY PARK | 2 | | CORN RD | 2 | | DAKOTA STREET | 2 | | DEPT OF SOCIAL SERVICES | 2 | | DILLION RESIDENCE | 2 | | DUMP ROAD | 2 | | E OF THE CLUB | 2 | | EAST HIGHWAY 18 | 2 | | EAST OF HARLEY SWANSON | 2 | | EAST OF SUNRISE APTS | 2 | | ELSIE ST COR | 2 | | ELSIE ST ST | 2 | | GUS STOP | 2 | | H18 BIA | 2 | | HEINERTS TRAILER COURT | 2 | | HIGHWAY 18 HWY | 2 | | HIGHWAY 83 | 2 | | HIGHWAY 83 HWY | 2 | | HIGHWAY 83 SOUTH | 2 | | HILLSIDE DR | 2 | | HOME QUEST | 2 | | HOUSE 504 WHITE HORSE | 2 | | HWY 18 E | 2 | | |
|
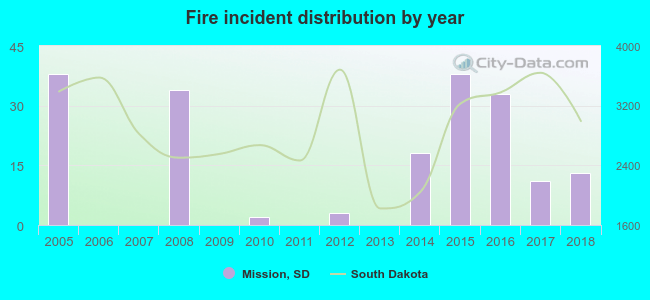 Based on the data from the years 2005 - 2018 the average number of fires per year is 14. The highest number of reported fire incidents - 38 took place in 2005, and the least - 0 in 2006. The data has a dropping trend.
 34.2% incidents where reported in the morning and 65.8% in the evening. The most fires (19.5%) took place on Sunday, and the least (8.9%) on Thursday.
 Based on the 190 fires from years 2005 - 2018 most fires (14.7%) took place during July, and the least (3.7%) in February.
 Out of all 301 cases reported during the years 2005 - 2018, the most belonged to the categories: Fire (63.1%), Rescue & EMS (10.6%), and Overpressure Rupture (8.6%).
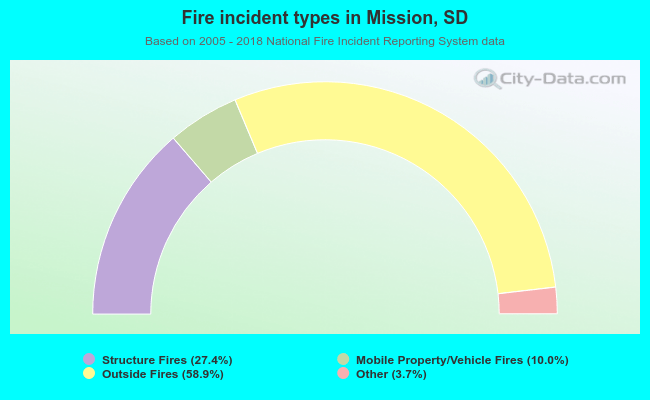 When looking into fire subcategories, the most incidents belonged to: Outside Fires (58.9%), and Structure Fires (27.4%).