Mohawk: Fire Incidents, New York (NY)
Where are fire incidents reported in Mohawk, NY
Something went wrong! Please refresh the page.
|
| |||||||||||||||||||||||||||||||||||||||||||||||||||||||||||||||||||||||||||||||||||||||||||||||||||||||||||||
2002 - 2018 National Fire Incident Reporting System (NFIRS) incidents
- Incident types reported to NFIRS in Mohawk, NY
- 71541.1%Hazardous Condition
- 45125.9%Fire
- 1569.0%Good Intent Call
- 1518.7%Rescue & EMS
- 1337.6%False Alarm
- 1096.3%Service Call
- 171.0%Severe Weather
- 60.3%Overpressure Rupture
- 30.2%Special Incident
- Fire incident types reported to NFIRS in Mohawk, NY
- 25456.3%Structure Fires
- 11725.9%Outside Fires
- 7115.7%Mobile Property/Vehicle Fires
- 92.0%Other
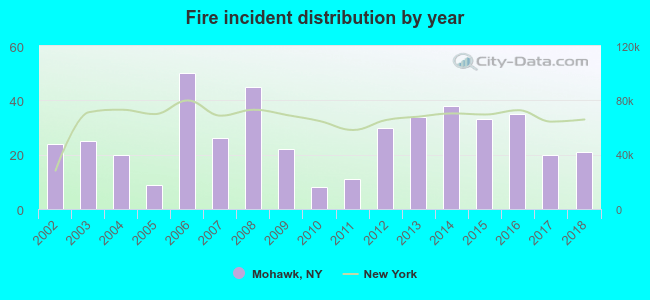 According to the data from the years 2002 - 2018 the average number of fire incidents per year is 27. The highest number of reported fire incidents - 50 took place in 2006, and the least - 8 in 2010. The data has a declining trend.
 32.4% incidents where reported in the morning and 67.6% in the evening. The most fires (18.0%) took place on Saturday, and the least (11.1%) on Wednesday.
 Based on the 451 fire incidents from years 2002 - 2018 most fires (15.1%) took place during April, and the least (4.4%) in July.
 Out of all 1,741 cases reported during the years 2002 - 2018, the most belonged to the categories: Hazardous Condition (41.1%), Fire (25.9%), and Good Intent Call (9.0%).
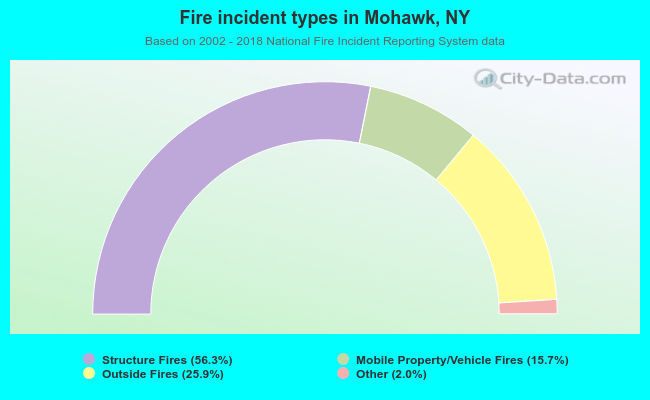 When looking into fire subcategories, the most incidents belonged to: Structure Fires (56.3%), and Outside Fires (25.9%).