Montgomery: Fire Incidents, Illinois (IL)
Where are fire incidents reported in Montgomery, IL
Something went wrong! Please refresh the page.
| Fire incidents reported | |
|---|---|
| Sreet name | Count |
| AUCUTT RD | 72 |
| LAKE ST | 66 |
| MONTGOMERY RD | 62 |
| JERICHO RD | 60 |
| DOUGLAS RD | 50 |
| ORCHARD RD | 50 |
| CIRCLE DR | 42 |
| RIVER ST | 40 |
| BASELINE RD | 36 |
| RT 30 | 34 |
| KNELL RD | 32 |
| RT 31 | 32 |
| BOULDER HILL PASS | 28 |
| MAIN ST | 28 |
| ROUTE 30 | 26 |
| VICTORIA DR | 24 |
| LAKEWOOD CREEK DR | 22 |
| LONGBEACH RD | 22 |
| BRIARCLIFF RD | 20 |
| FERNWOOD RD | 20 |
| ROUTE 31 | 20 |
| INGLESHIRE RD | 18 |
| SHERMAN AVE | 18 |
| GALENA RD | 16 |
| ROCHESTER DR | 16 |
| SAUGATUCK RD | 16 |
| GREENFIELD AVE | 14 |
| OGDEN AV | 14 |
| RAYMOND DR | 14 |
| CONCORD DR | 12 |
| Other | 208 |
2002 - 2018 National Fire Incident Reporting System (NFIRS) incidents
- Incident types reported to NFIRS in Montgomery, IL
- 9,59067.3%Rescue & EMS
- 1,52210.7%Hazardous Condition
- 1,1548.1%False Alarm
- 1,1327.9%Fire
- 5263.7%Good Intent Call
- 2802.0%Service Call
- 210.1%Overpressure Rupture
- Fire incident types reported to NFIRS in Montgomery, IL
- 47542.0%Structure Fires
- 44639.4%Outside Fires
- 17515.5%Mobile Property/Vehicle Fires
- 363.2%Other
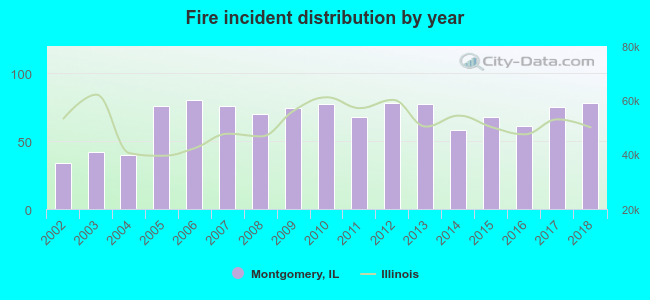 Based on the data from the years 2002 - 2018 the average number of fire incidents per year is 67. The highest number of fires - 80 took place in 2006, and the least - 34 in 2002. The data has a growing trend.
The average number of yearly fire incidents per 10k residents in Montgomery, IL compared to nearest cities:
(Note: Based on data for the last 3 years, including only cities with population 5,000 and above)
| Montgomery: | 37.0 |
| Oswego: | 18.8 |
| Aurora: | 11.7 |
| North Aurora: | 16.9 |
| Sugar Grove: | 41.0 |
| Batavia: | 30.0 |
| Yorkville: | 42.2 |
| Naperville: | 16.1 |
| Warrenville: | 33.7 |
 The median response time based on all reported fire incidents is 6 minutes. This is about the same as the Illinois median value.
The median response time in Montgomery, IL compared to nearest cities:
(Note: Based on data for all years, including only cities with at least 500 fire incidents)
| Montgomery: | 6 minutes |
| Oswego: | 6 minutes |
| Aurora: | 5 minutes |
| North Aurora: | 5 minutes |
| Sugar Grove: | 7 minutes |
| Batavia: | 5 minutes |
| Yorkville: | 6 minutes |
| Naperville: | 5 minutes |
| Warrenville: | 5 minutes |
 According to the reports from the years 2002 - 2018 the average number of fire-related yearly casualties is 1. The highest number of reported injuries - 5 took place in 2012, and the lowest - 0 in 2007. The data has a constant trend.
The average number of casualties per 1,000 fire incidents is 20. This indicator was the highest - 64 in 2012, and the lowest 0 in 2007. The trend for injuries per 1,000 fire incidents is dropping. Compared to the state value the number of casualties per 1,000 fire incidents is higher.
According to the reports from the years 2002 - 2018 the average number of fire-related yearly casualties is 1. The highest number of reported injuries - 5 took place in 2012, and the lowest - 0 in 2007. The data has a constant trend.
The average number of casualties per 1,000 fire incidents is 20. This indicator was the highest - 64 in 2012, and the lowest 0 in 2007. The trend for injuries per 1,000 fire incidents is dropping. Compared to the state value the number of casualties per 1,000 fire incidents is higher.Casualties per 1,000 incidents in Montgomery, IL compared to nearest cities:
(Note: Based on data for all years, including only cities with at least 500 fire incidents)
| Montgomery: | 20.3 |
| Oswego: | 12.3 |
| Aurora: | 14.2 |
| North Aurora: | 0.0 |
| Sugar Grove: | 4.3 |
| Batavia: | 10.8 |
| Yorkville: | 15.6 |
| Naperville: | 23.5 |
| Warrenville: | 33.4 |
 30.5% incidents where reported in the morning and 69.5% in the evening. The most fires (15.8%) took place on Monday, and the least (12.3%) on Tuesday.
 According to the 1,132 incident reports from years 2002 - 2018 most fires (12.3%) took place during July, and the least (5.3%) in January.
 Out of all 14,242 cases reported during the years 2002 - 2018, the most belonged to the categories: Rescue & EMS (67.3%), Hazardous Condition (10.7%), and False Alarm (8.1%).
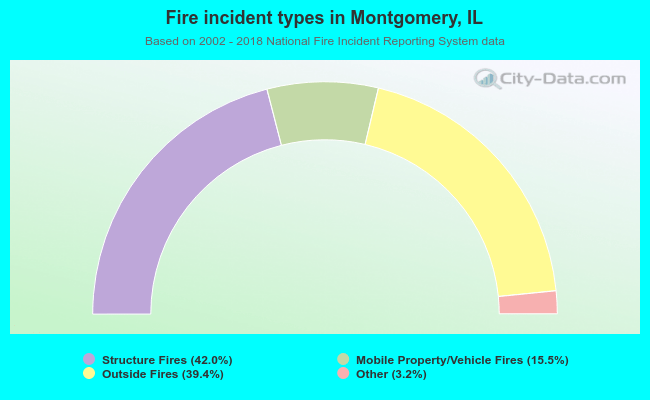 When looking into fire subcategories, the most incidents belonged to: Structure Fires (42.0%), and Outside Fires (39.4%).