| Fire incidents reported |
|---|
| Sreet name | Count |
|---|
| SR 78 EAST | 12 | | US 27 | 12 | | US 27 NORTH | 12 | | GLADES COUNTY HUNT CLUB | 8 | | RIVER RD | 8 | | US 27 N | 8 | | US 27 SOUTH | 8 | | 1195 PONY PLACE | 6 | | 300 AVE K | 6 | | ALVIN WARD BOAT RAMP | 6 | | CURRY ISLAND | 6 | | GLADES COUNTY | 6 | | HICKPOOCHEE SOUTH | 6 | | SR 78 EAST CURRY ISLAND | 6 | | SR 78 WEST | 6 | | 1100 US 27 | 4 | | 1176 GREEN ST | 4 | | 2587 RIVER RD | 4 | | 6TH ST | 4 | | 728 AVE A | 4 | | 78 EAST | 4 | | AVE N | 4 | | BUSTER TWIN RD | 4 | | GLADES COUNTY LANDFILL | 4 | | HWY 27 NORTH | 4 |
| | | Fire incidents reported |
|---|
| Sreet name | Count |
|---|
| RIVER ROAD | 4 | | RIVERSIDE DR | 4 | | SR 80 | 4 | | STATE ROUTE 80 | 4 | | THOMAS ST | 4 | | 1025 THOMAS ST | 2 | | 1037 LILLY DRIVE | 2 | | 1047 CALOOSAHATCHEE DR | 2 | | 1061 WILSON ST | 2 | | 1065 WEST AVE | 2 | | 1080 WAGON TR | 2 | | 1081 CURRY ISLAND | 2 | | 1085 WEST AVE | 2 | | 1090 FOXMOORE ST | 2 | | 10TH AND AVE R | 2 | | 1100 S US HIGHWAY 27 | 2 | | 1141 PONY PLACE | 2 | | 1141 RIVER RD | 2 | | 1148 PLYANT DR | 2 | | 1152 WEST AVE | 2 | | 1161 ANVIL WAY | 2 | | 1190 SEMINOLE CIRCLE | 2 | | 1198 SW 27 | 2 | | 1244 CYPRESS AVE | 2 | | |
|
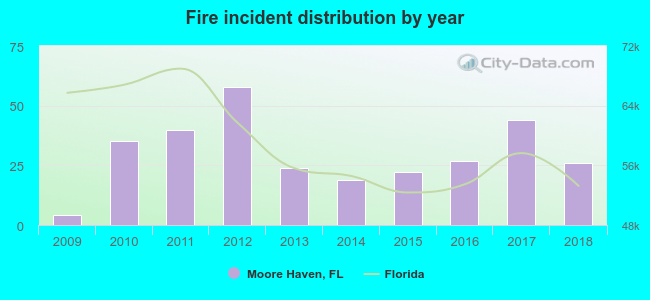 Based on the data from the years 2009 - 2018 the average number of fires per year is 30. The highest number of fires - 58 took place in 2012, and the least - 4 in 2009. The data has a rising trend.
 22.1% incidents where reported in the morning and 77.9% in the evening. The most fires (19.1%) took place on Monday, and the least (8.4%) on Saturday.
 Based on the 299 reports from years 2009 - 2018 most fires (19.4%) took place during April, and the least (3.7%) in October.
 Out of all 1,125 cases reported during the years 2009 - 2018, the most belonged to the categories: Rescue & EMS (44.6%), Fire (26.6%), and Good Intent Call (12.1%).
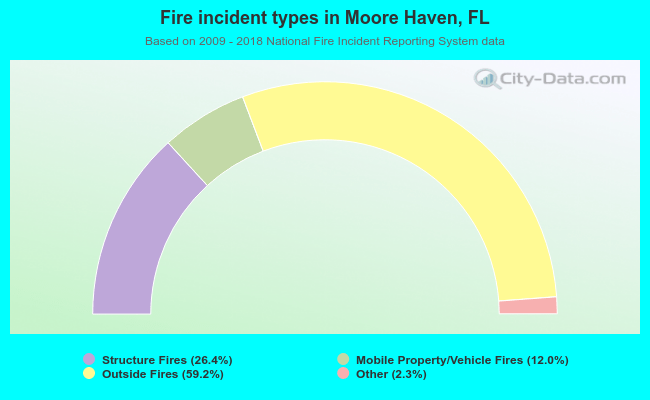 When looking into fire subcategories, the most reports belonged to: Outside Fires (59.2%), and Structure Fires (26.4%).