Mooresboro: Fire Incidents, North Carolina (NC)
Where are fire incidents reported in Mooresboro, NC
Something went wrong! Please refresh the page.
|
| |||||||||||||||||||||||||||||||||||||||||||||||||||||||||||||||||||||||||||||||||||||||||||||||||||||||||||||
| Other | 114 | |||||||||||||||||||||||||||||||||||||||||||||||||||||||||||||||||||||||||||||||||||||||||||||||||||||||||||||
2002 - 2018 National Fire Incident Reporting System (NFIRS) incidents
- Incident types reported to NFIRS in Mooresboro, NC
- 1,74546.9%Rescue & EMS
- 88623.8%Fire
- 48112.9%Hazardous Condition
- 3158.5%Good Intent Call
- 1343.6%Service Call
- 732.0%False Alarm
- 721.9%Severe Weather
- 130.3%Special Incident
- 40.1%Overpressure Rupture
- Fire incident types reported to NFIRS in Mooresboro, NC
- 44550.2%Structure Fires
- 33237.5%Outside Fires
- 647.2%Mobile Property/Vehicle Fires
- 455.1%Other
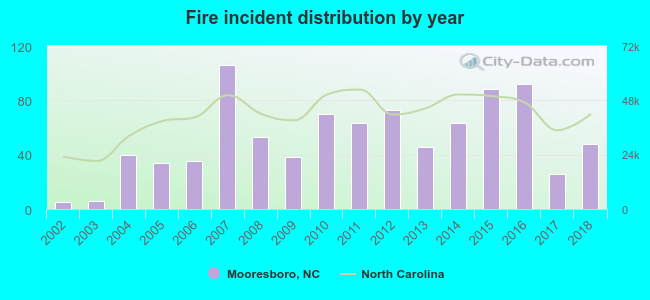 Based on the data from the years 2002 - 2018 the average number of fires per year is 52. The highest number of reported fire incidents - 106 took place in 2007, and the least - 5 in 2002. The data has a rising trend.
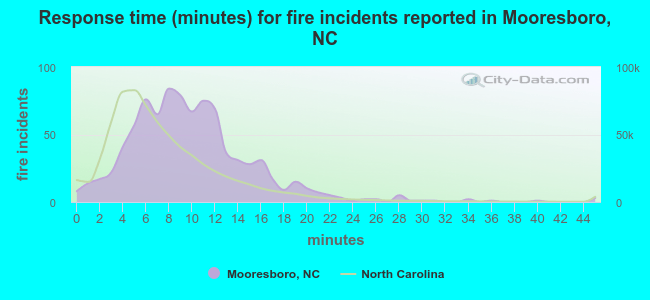 The median response time based on all reported fire incidents is 9 minutes. This is higher compared to the North Carolina median value.
The median response time in Mooresboro, NC compared to nearest cities:
(Note: Based on data for all years, including only cities with at least 500 fire incidents)
| Mooresboro: | 9 minutes |
| Ellenboro: | 8 minutes |
| Bostic: | 10 minutes |
| Shelby: | 8 minutes |
| Forest City: | 6 minutes |
| Lawndale: | 8 minutes |
| Rutherfordton: | 8 minutes |
| Grover: | 7 minutes |
| Cherryville: | 7 minutes |
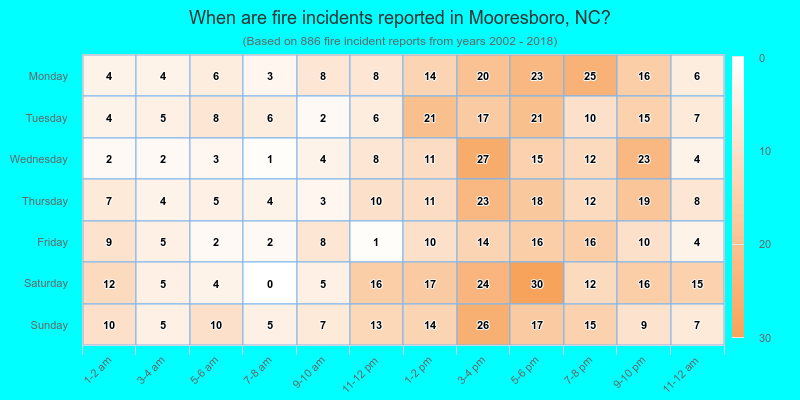
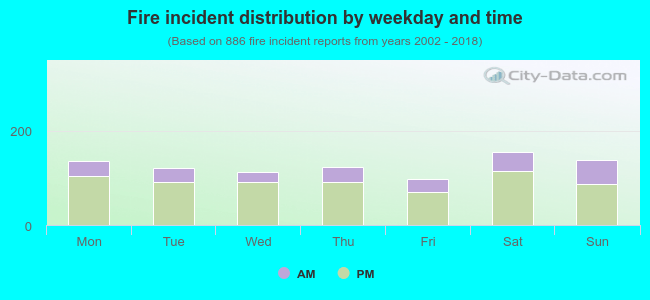 26.6% incidents where reported in the morning and 73.4% in the evening. The most fires (17.6%) took place on Saturday, and the least (10.9%) on Friday.
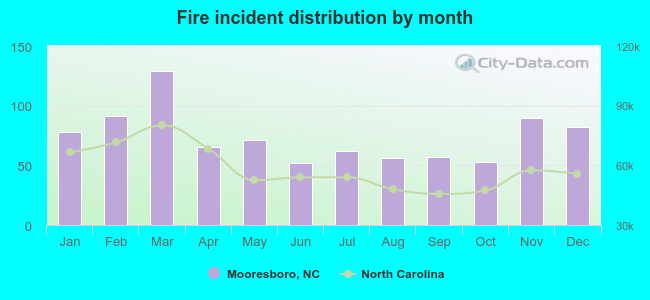 According to the 886 incident reports from years 2002 - 2018 most fires (14.6%) took place during March, and the least (5.9%) in June.
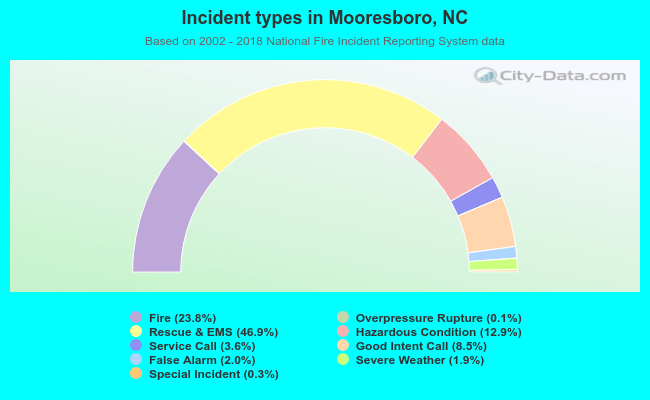 Out of all 3,723 cases reported during the years 2002 - 2018, the most belonged to the categories: Rescue & EMS (46.9%), Fire (23.8%), and Hazardous Condition (12.9%).
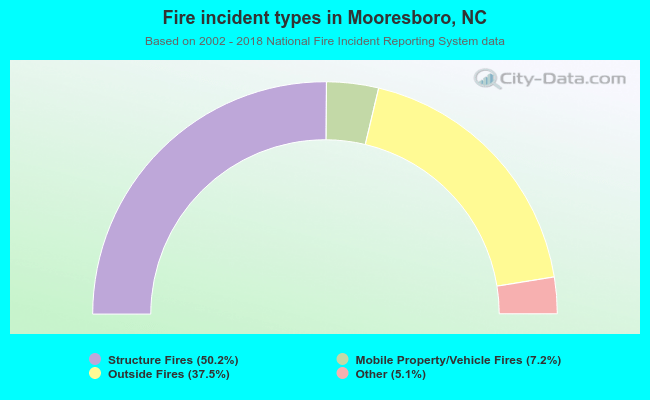 When looking into fire subcategories, the most reports belonged to: Structure Fires (50.2%), and Outside Fires (37.5%).