| Fire incidents reported |
|---|
| Sreet name | Count |
|---|
| HARDYVILLE RD. | 12 | | MACON KESSINGER RD | 10 | | MACON KESSINGER ROAD | 10 | | BROADFORD ROAD | 8 | | PRICEVILLE ROAD | 8 | | 6793 CUB RUN HWY | 6 | | 8472 CUB RUN HWY | 6 | | BOYDS KNOB RD. | 6 | | BUNNELL CROSSING RD | 6 | | HARDYVILLE RD | 6 | | I65 HWY | 6 | | RAIDER HOLLOW ROAD | 6 | | 10747 PRICEVILLE RD | 4 | | 1284 MACON KESSINGER RD | 4 | | 131 WALTON AVE | 4 | | 1444 BOILING SPRINGS RD | 4 | | 5685 N JACKSON HWY | 4 | | 67 CEDAR LANE | 4 | | 8631 CUB RUN HWY | 4 | | 9783 CUB RUN HWY | 4 | | 997 OLD CUT RD | 4 | | BOILING SPRINGS RD | 4 | | BOILING SPRINGS RD. | 4 | | BOYDS KNOB RD | 4 | | CAVE HILL ROAD | 4 |
| | | Fire incidents reported |
|---|
| Sreet name | Count |
|---|
| CAVE HILL ROAD | 4 | | CHARLES JAGGERS ROAD | 4 | | CUB RUN HWY | 4 | | DIXIE HWY | 4 | | I-65 65.5 MM SB | 4 | | LONOKE RD | 4 | | LONOKE RD. | 4 | | MCCUBBINS LANE | 4 | | MILL ST. | 4 | | OLD MAIN ST | 4 | | ROUND BOTTOM RD. | 4 | | ROWLETTS CAVE SPRINGS RD | 4 | | ROWLETTS HEIGHTS LN | 4 | | SHADY LANE CH. RD. | 4 | | WHEELER HORTON ROAD | 4 | | 100 MAPLE GROVE LANE | 2 | | 100 OLD MAIN ST | 2 | | 1000 BL ROWLETTS CAVE SPRING | 2 | | 10000 BLOCK CUB RUN HWY. | 2 | | 10000 CUB RUN HWY | 2 | | 1001 BUNNELL CROSSING | 2 | | 10132 CUB RUN HWY | 2 | | 103 ELM ST. | 2 | | 1055 JL THOMAS RD BONNIEVILLE | 2 | | |
|
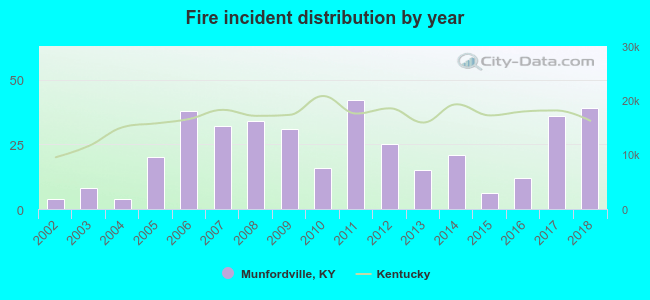 Based on the data from the years 2002 - 2018 the average number of fire incidents per year is 23. The highest number of fire incidents - 42 took place in 2011, and the least - 4 in 2002. The data has a growing trend.
 31.9% incidents where reported in the morning and 68.1% in the evening. The most fires (16.7%) took place on Monday, and the least (12.5%) on Friday.
 Based on the 383 incident reports from years 2002 - 2018 most fires (15.4%) took place during March, and the least (3.1%) in May.
 Out of all 1,654 cases reported during the years 2002 - 2018, the most belonged to the categories: Overpressure Rupture (47.3%), Fire (23.2%), and Service Call (10.8%).
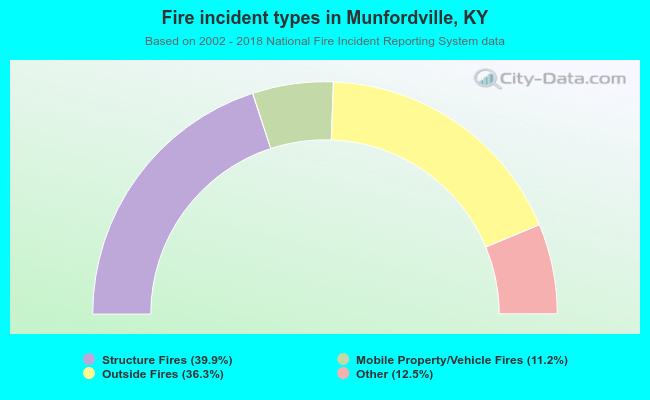 When looking into fire subcategories, the most incidents belonged to: Structure Fires (39.9%), and Outside Fires (36.3%).