Muscle Shoals: Fire Incidents, Alabama (AL)
Where are fire incidents reported in Muscle Shoals, AL
Something went wrong! Please refresh the page.
| Fire incidents reported | |
|---|---|
| Sreet name | Count |
| AVALON AVE | 316 |
| 2ND ST | 211 |
| WOODWARD | 176 |
| 2ND ST | 160 |
| WILSON DAM RD | 122 |
| RIVER RD | 115 |
| 6TH STREET | 109 |
| WOODWARD AVE | 104 |
| SECOND ST | 87 |
| HWY 20 | 83 |
| FORD RD | 68 |
| GRAND | 58 |
| RIVER RD | 58 |
| PASADENA AVE | 53 |
| EDISON AVE | 50 |
| HARDING AVE | 50 |
| FORD AVE | 49 |
| COUNTY LINE RD | 45 |
| FORDSWAY AVE | 45 |
| BAINBRIDGE RD | 44 |
| ELLEDGE LA | 43 |
| RIVER ROAD | 39 |
| TYLER AVE | 39 |
| FORD ST | 38 |
| ELLEDGE LANE | 37 |
| GLENDALE AVE | 35 |
| MARKATE | 34 |
| SIXTH ST | 34 |
| FIRESTONE AVE | 33 |
| MICHIGAN AVE | 33 |
2003 - 2018 National Fire Incident Reporting System (NFIRS) incidents
- Incident types reported to NFIRS in Muscle Shoals, AL
- 1,85550.9%Rescue & EMS
- 1,13631.2%Fire
- 3008.2%Hazardous Condition
- 1885.2%False Alarm
- 732.0%Service Call
- 621.7%Good Intent Call
- 100.3%Special Incident
- 90.2%Overpressure Rupture
- 90.2%Severe Weather
- Fire incident types reported to NFIRS in Muscle Shoals, AL
- 48342.5%Outside Fires
- 26022.9%Structure Fires
- 21418.8%Other
- 17915.8%Mobile Property/Vehicle Fires
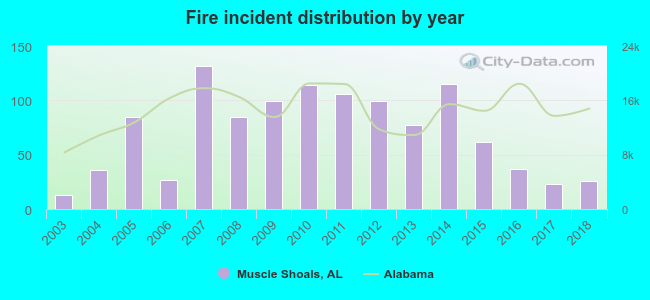 Based on the data from the years 2003 - 2018 the average number of fires per year is 71. The highest number of reported fire incidents - 132 took place in 2007, and the least - 13 in 2003. The data has a rising trend.
The average number of yearly fire incidents per 10k residents in Muscle Shoals, AL compared to nearest cities:
(Note: Based on data for the last 3 years, including only cities with population 5,000 and above)
| Muscle Shoals: | 21.1 |
| Tuscumbia: | 49.2 |
| Florence: | 64.9 |
| Cloverdale: | 1.6 |
| Russellville: | 71.0 |
| Athens: | 38.1 |
| Decatur: | 46.8 |
| Danville: | 1.6 |
| Hartselle: | 31.6 |
 The median response time based on all reported fire incidents is 4 minutes. This is lower compared to the state median value.
The median response time in Muscle Shoals, AL compared to nearest cities:
(Note: Based on data for all years, including only cities with at least 500 fire incidents)
| Muscle Shoals: | 4 minutes |
| Florence: | 5 minutes |
| Russellville: | 5 minutes |
| Moulton: | 9 minutes |
| Haleyville: | 6 minutes |
| Athens: | 4 minutes |
| Decatur: | 5 minutes |
| Hartselle: | 5 minutes |
| Hamilton: | 8 minutes |
 According to the reports from the years 2003 - 2018 the average number of fire-related fatalities per year is 0. The highest number of reported deaths - 3 took place in 2014, and the lowest - 0 in 2003. The data has a constant trend.
 28.7% incidents where reported in the morning and 71.3% in the evening. The most fires (15.9%) took place on Thursday, and the least (13.4%) on Tuesday.
 According to the 1,136 fire incident reports from years 2003 - 2018 most fires (12.3%) took place during January, and the least (6.5%) in April.
 Out of all 3,642 cases reported during the years 2003 - 2018, the most belonged to the categories: Rescue & EMS (50.9%), Fire (31.2%), and Hazardous Condition (8.2%).
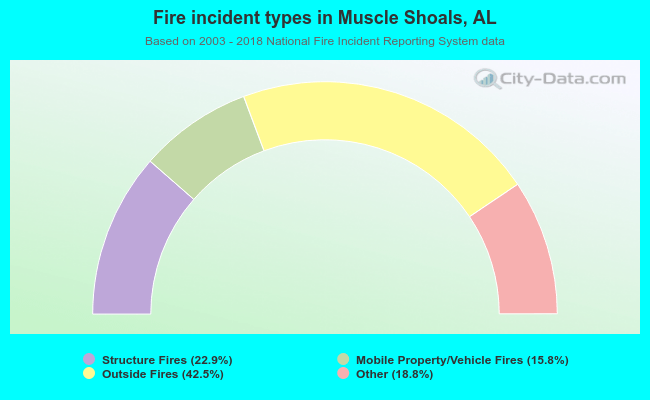 When looking into fire subcategories, the most reports belonged to: Outside Fires (42.5%), and Structure Fires (22.9%).