Nantucket: Fire Incidents, Massachusetts (MA)
Where are fire incidents reported in Nantucket, MA
Something went wrong! Please refresh the page.
| Fire incidents reported | |
|---|---|
| Sreet name | Count |
| ORANGE ST | 64 |
| MAIN ST | 44 |
| MADAKET RD | 42 |
| POLPIS RD | 36 |
| PLEASANT ST | 28 |
| BROAD ST | 26 |
| OLD SOUTH RD | 26 |
| CENTER ST | 24 |
| SURFSIDE RD | 22 |
| AIRPORT RD | 20 |
| CLIFF RD | 20 |
| MILESTONE RD | 20 |
| EASTON ST | 18 |
| ESSEX RD | 18 |
| GOLDFINCH DR | 18 |
| HUMMOCK POND RD | 18 |
| AMELIA DR | 16 |
| KILLDEER LN | 16 |
| MADAKET | 16 |
| SPARKS AV | 16 |
| EASTON | 14 |
| SPARKS | 14 |
| VESTAL ST | 14 |
| BARTLETT RD | 12 |
| CYNTHIA LN | 12 |
| EEL POINT RD | 12 |
| FAIR ST | 12 |
| INDIA ST | 12 |
| MILK ST | 12 |
| PROSPECT ST | 12 |
| Other | 337 |
2002 - 2018 National Fire Incident Reporting System (NFIRS) incidents
- Incident types reported to NFIRS in Nantucket, MA
- 5,06738.0%Rescue & EMS
- 3,78128.3%False Alarm
- 2,75520.7%Hazardous Condition
- 9717.3%Fire
- 4113.1%Service Call
- 3132.3%Good Intent Call
- 160.1%Overpressure Rupture
- 160.1%Special Incident
- Fire incident types reported to NFIRS in Nantucket, MA
- 57459.1%Structure Fires
- 18519.1%Outside Fires
- 11611.9%Mobile Property/Vehicle Fires
- 969.9%Other
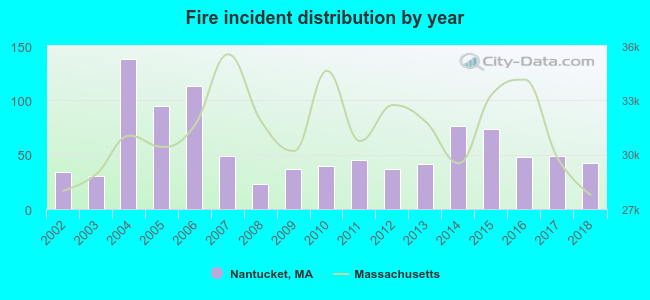 According to the data from the years 2002 - 2018 the average number of fires per year is 57. The highest number of reported fire incidents - 138 took place in 2004, and the least - 23 in 2008. The data has an increasing trend.
The average number of yearly fire incidents per 10k residents in Nantucket, MA compared to nearest cities:
(Note: Based on data for the last 3 years, including only cities with population 5,000 and above)
| Nantucket: | 62.2 |
| West Yarmouth: | 31.6 |
| South Yarmouth: | 34.9 |
| Yarmouth: | 2.4 |
| Harwich: | 42.2 |
| Yarmouth Port: | 16.3 |
| East Falmouth: | 53.5 |
| Mashpee: | 34.7 |
| Mattapoisett: | 32.5 |
 The median response time based on all reported fire incidents is 6 minutes. This is higher compared to the Massachusetts median value.
The median response time in Nantucket, MA compared to nearest cities:
(Note: Based on data for all years, including only cities with at least 500 fire incidents)
| Nantucket: | 6 minutes |
| South Yarmouth: | 5 minutes |
| Harwich: | 6 minutes |
| Mashpee: | 7 minutes |
| Falmouth: | 4 minutes |
| Brewster: | 8 minutes |
| Orleans: | 7 minutes |
| East Sandwich: | 8 minutes |
| Sandwich: | 6 minutes |
 Based on the data from the years 2002 - 2018 the average number of fire-related yearly casualties is 0. The highest number of injuries - 1 took place in 2004, and the lowest - 0 in 2002. The data has a constant trend.
The average number of injuries per 1,000 fire incidents is 2. This indicator was the highest - 14 in 2015, and the lowest 0 in 2002. The trend for injuries per 1,000 fire incidents is constant. Compared to the Massachusetts value the number of injuries per 1,000 fires is much lower.
Based on the data from the years 2002 - 2018 the average number of fire-related yearly casualties is 0. The highest number of injuries - 1 took place in 2004, and the lowest - 0 in 2002. The data has a constant trend.
The average number of injuries per 1,000 fire incidents is 2. This indicator was the highest - 14 in 2015, and the lowest 0 in 2002. The trend for injuries per 1,000 fire incidents is constant. Compared to the Massachusetts value the number of injuries per 1,000 fires is much lower.Casualties per 1,000 incidents in Nantucket, MA compared to nearest cities:
(Note: Based on data for all years, including only cities with at least 500 fire incidents)
| Nantucket: | 3.1 |
| South Yarmouth: | 33.2 |
| Harwich: | 36.4 |
| Mashpee: | 26.7 |
| Falmouth: | 38.8 |
| Brewster: | 10.6 |
| Orleans: | 7.5 |
| East Sandwich: | 29.8 |
| Sandwich: | 18.4 |
 30.4% incidents where reported in the morning and 69.6% in the evening. The most fires (16.2%) took place on Wednesday, and the least (12.4%) on Friday.
 According to the 971 fires from years 2002 - 2018 most fires (13.4%) took place during July, and the least (5.6%) in November.
 Out of all 13,338 cases reported during the years 2002 - 2018, the most belonged to the categories: Rescue & EMS (38.0%), False Alarm (28.3%), and Hazardous Condition (20.7%).
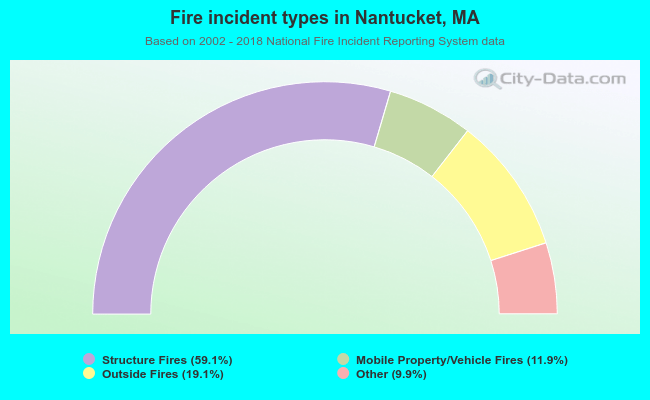 When looking into fire subcategories, the most incidents belonged to: Structure Fires (59.1%), and Outside Fires (19.1%).