| Fire incidents reported |
|---|
| Sreet name | Count |
|---|
| HIGHWAY 96 | 10 | | CEDAR | 6 | | 110 ROAD | 4 | | DEPOT ST | 4 | | FRANKLIN | 4 | | IOWA | 4 | | K96 | 4 | | KANSAS | 4 | | SYCAMORE | 4 | | SYCAMORE AVE | 4 | | 1 NORTH AND ONE EAST OF NESS | 2 | | 1 NORTH, 2 WEST, 1 NORTH | 2 | | 110 AND Y ROAD | 2 | | 180 AVE | 2 | | 20 ROAD AND R ROAD | 2 | | 200 AND U ROAD | 2 | | 3 MILES N OF NESS CITY ON R RD | 2 | | 3 WEST ON HWY 96 | 2 | | 304 NORTH COURT ST | 2 | | 5 MILES NORTH ON 283 | 2 | | 5TH ST | 2 | | 7 WEST TO J RD. 1.5 MILES N. | 2 | | 96 HWY AND J ROAD | 2 | | CHERRY AND PENN | 2 | | CHESTNUT | 2 |
| | | Fire incidents reported |
|---|
| Sreet name | Count |
|---|
| COUNTY ROAD RDS | 2 | | CRESCENT | 2 | | DEPOT | 2 | | FRANKLIN ST | 2 | | HIGH | 2 | | HIGHWAY 283 | 2 | | HWY 283 | 2 | | IOWA AVE | 2 | | LOCUST ST | 2 | | M ROAD AND 50TH ROAD | 2 | | N ROAD AND 180 | 2 | | O ROAD AND 60TH | 2 | | PARK | 2 | | PENN AVE, | 2 | | PENN AVE. | 2 | | PENNSYLVANIA AVE | 2 | | RD 110 AND W RD | 2 | | RD W AND 160TH | 2 | | ROAD P AND 10 ROAD | 2 | | SCHOOL | 2 | | SOUTH ON 283 TO RD 20 | 2 | | T ROAD AND 150 RD | 2 | | US HWY 283 | 2 | | WALNUT | 2 | | |
|
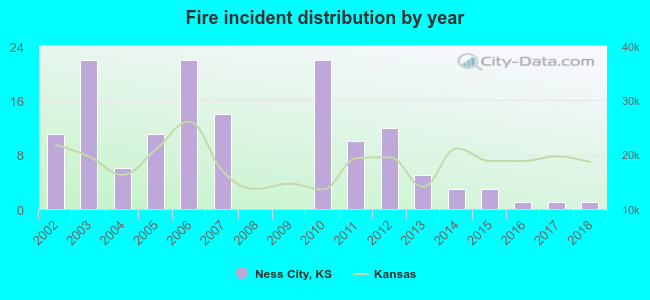 Based on the data from the years 2002 - 2018 the average number of fires per year is 8. The highest number of reported fire incidents - 22 took place in 2003, and the least - 0 in 2008. The data has a dropping trend.
 28.5% incidents where reported in the morning and 71.5% in the evening. The most fires (17.4%) took place on Thursday, and the least (10.4%) on Saturday.
 Based on the 144 fire incident reports from years 2002 - 2018 most fires (15.3%) took place during June, and the least (2.8%) in December.
 Out of all 149 cases reported during the years 2002 - 2018, the most belonged to the categories: Fire (96.6%), Overpressure Rupture (0.7%), and Rescue & EMS (0.7%).
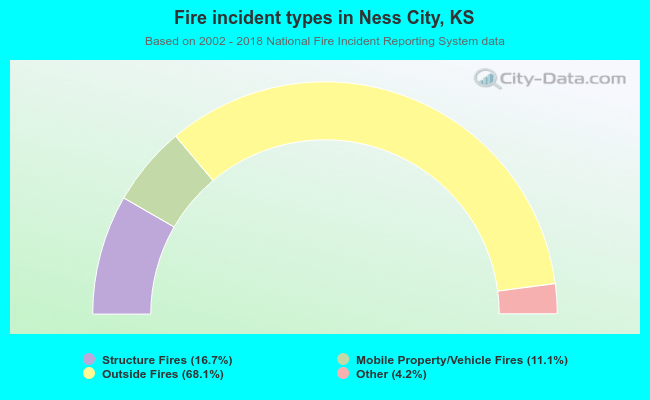 When looking into fire subcategories, the most reports belonged to: Outside Fires (68.1%), and Structure Fires (16.7%).