| Fire incidents reported |
|---|
| Sreet name | Count |
|---|
| 8945 COUNTY ROAD 431 | 10 | | COUNTY ROAD 363 | 10 | | ST HWY 54 | 10 | | 1804 CO RD 356 | 8 | | HWY 54 | 8 | | STATE ROAD J | 8 | | 10007 CO RD 441 | 6 | | 1495 CO RD 364 | 6 | | ST RD J | 6 | | U.S. HIGHWAY 54 | 6 | | 10054 CO RD 441 | 4 | | 10200 KRCMAR TRAIL | 4 | | 1333 CO RD 373 | 4 | | 1900 CO RD 364 | 4 | | 2309 CO RD 370 | 4 | | 2564 CO RD 338 | 4 | | 2848 CO RD 496 | 4 | | 2991 ST HWY TT | 4 | | 3692 ST RD TT | 4 | | 3800 ST RD TT | 4 | | 507 REDWOOD DR | 4 | | 621 REDWOOD DRIVE | 4 | | 7428 CO RD 361 | 4 | | 7513 COUNTY ROAD 363 | 4 | | 8051 ST RD J | 4 |
| | | Fire incidents reported |
|---|
| Sreet name | Count |
|---|
| 8216 HIGH OAK | 4 | | 8981 COUNTY ROAD 433 | 4 | | 9354 KNOWN PLACE | 4 | | 9810 STATE RD AE | 4 | | 9810 STATE ROAD AE | 4 | | COUNTY ROAD 367 | 4 | | HIGHWAY 54 | 4 | | OLD HWY 54 | 4 | | PINE RIDGE CAMPGROUND | 4 | | ST HWY J | 4 | | ST RD BB | 4 | | ST RD MM | 4 | | ST RD TT | 4 | | ST RD Y | 4 | | STATE ROAD BB | 4 | | 10009 CO RD 371 | 2 | | 10017 CO RD 367 | 2 | | 10054 RD | 2 | | 10084 CO RD 441 | 2 | | 10123 CO RD 367 | 2 | | 1019 STATE ROAD MM | 2 | | 10205 CO RD 441 | 2 | | 1024 SR MM | 2 | | 1024 ST HWY MM | 2 | | 1024 ST RD MM | 2 |
|
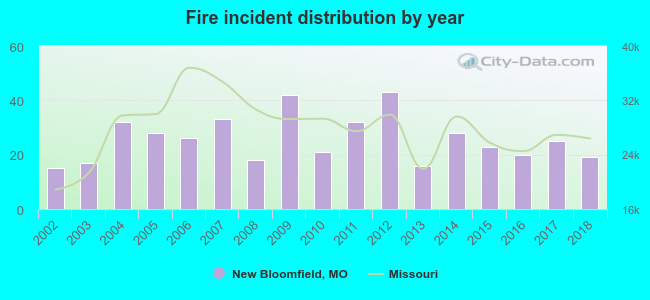 According to the data from the years 2002 - 2018 the average number of fires per year is 26. The highest number of fires - 43 took place in 2012, and the least - 15 in 2002. The data has a growing trend.
 26.0% incidents where reported in the morning and 74.0% in the evening. The most fires (17.1%) took place on Saturday, and the least (11.0%) on Tuesday.
 According to the 438 fire incidents from years 2002 - 2018 most fires (18.5%) took place during March, and the least (4.1%) in October.
 Out of all 1,655 cases reported during the years 2002 - 2018, the most belonged to the categories: Rescue & EMS (45.6%), Fire (26.5%), and Hazardous Condition (19.5%).
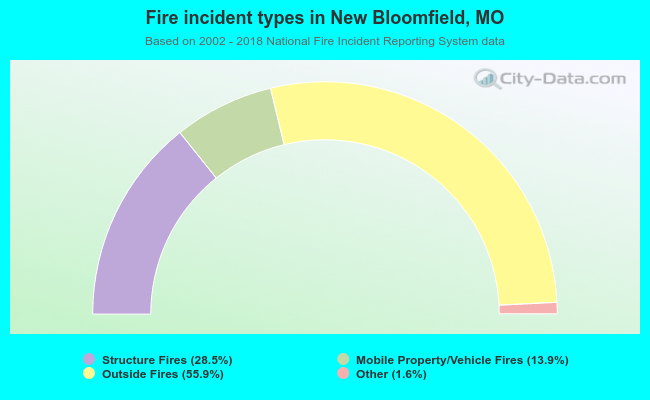 When looking into fire subcategories, the most reports belonged to: Outside Fires (55.9%), and Structure Fires (28.5%).