New Boston: Fire Incidents, New Hampshire (NH)
Where are fire incidents reported in New Boston, NH
Something went wrong! Please refresh the page.
|
| |||||||||||||||||||||||||||||||||||||||||||||||||||||||||||||||||||||||||||||||||||||||||||||||||||||||||||||
2003 - 2018 National Fire Incident Reporting System (NFIRS) incidents
- Incident types reported to NFIRS in New Boston, NH
- 1,15740.1%Rescue & EMS
- 58920.4%Hazardous Condition
- 39313.6%Fire
- 2809.7%Service Call
- 2057.1%False Alarm
- 1976.8%Good Intent Call
- 311.1%Special Incident
- 270.9%Severe Weather
- 40.1%Overpressure Rupture
- Fire incident types reported to NFIRS in New Boston, NH
- 21755.2%Structure Fires
- 10927.7%Outside Fires
- 4010.2%Other
- 276.9%Mobile Property/Vehicle Fires
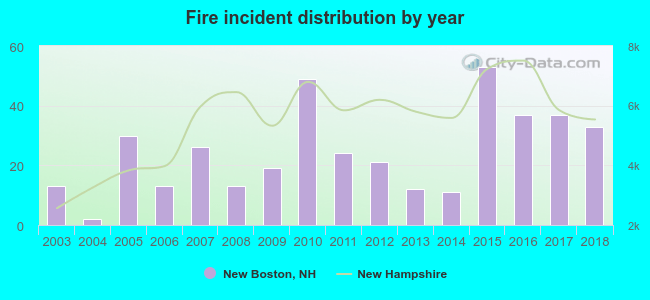 According to the data from the years 2003 - 2018 the average number of fires per year is 25. The highest number of reported fire incidents - 53 took place in 2015, and the least - 2 in 2004. The data has a rising trend.
The average number of yearly fire incidents per 10k residents in New Boston, NH compared to nearest cities:
(Note: Based on data for the last 3 years, including only cities with population 5,000 and above)
| New Boston: | 67.0 |
| Weare: | 58.1 |
| Goffstown: | 31.5 |
| Bedford: | 24.5 |
| Amherst: | 21.4 |
| Milford: | 47.2 |
| Manchester: | 27.2 |
| Merrimack: | 28.8 |
| Bow: | 72.7 |

 31.0% incidents where reported in the morning and 69.0% in the evening. The most fires (17.0%) took place on Saturday, and the least (11.5%) on Wednesday.
 According to the 393 fire incident reports from years 2003 - 2018 most fires (13.5%) took place during November, and the least (2.5%) in July.
 Out of all 2,883 cases reported during the years 2003 - 2018, the most belonged to the categories: Rescue & EMS (40.1%), Hazardous Condition (20.4%), and Fire (13.6%).
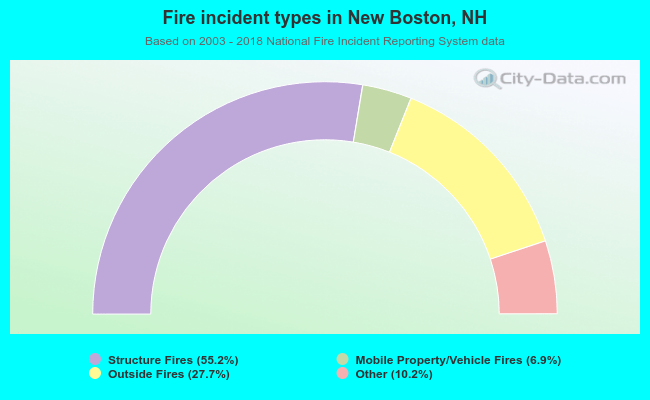 When looking into fire subcategories, the most reports belonged to: Structure Fires (55.2%), and Outside Fires (27.7%).