New Holland: Fire Incidents, Ohio (OH)
Where are fire incidents reported in New Holland, OH
Something went wrong! Please refresh the page.
|
| |||||||||||||||||||||||||||||||||||||||||||||||||||||||||||||||||||||||||||||||||||||||||||||||||||||||||||||
2003 - 2018 National Fire Incident Reporting System (NFIRS) incidents
- Incident types reported to NFIRS in New Holland, OH
- 32240.4%Fire
- 27434.4%Hazardous Condition
- 10012.5%Rescue & EMS
- 435.4%Service Call
- 273.4%Good Intent Call
- 141.8%Severe Weather
- 121.5%False Alarm
- 40.5%Overpressure Rupture
- 10.1%Special Incident
- Fire incident types reported to NFIRS in New Holland, OH
- 16250.3%Structure Fires
- 13341.3%Outside Fires
- 278.4%Mobile Property/Vehicle Fires
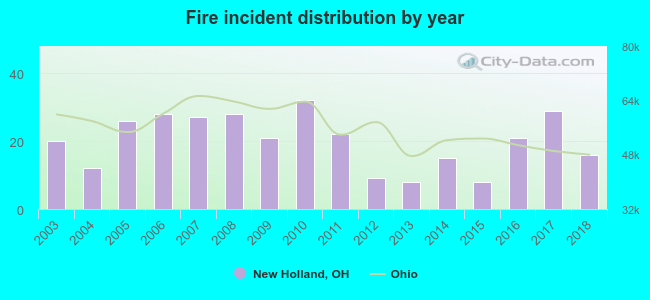 According to the data from the years 2003 - 2018 the average number of fires per year is 20. The highest number of reported fires - 32 took place in 2010, and the least - 8 in 2013. The data has a declining trend.
 Based on the data from the years 2003 - 2018 the average number of fire-related fatalities per year is 0. The highest number of deaths - 1 took place in 2006, and the lowest - 0 in 2003. The data has a constant trend.
 23.6% incidents where reported in the morning and 76.4% in the evening. The most fires (18.9%) took place on Saturday, and the least (10.6%) on Thursday.
 According to the 322 fires from years 2003 - 2018 most fires (13.0%) took place during October, and the least (4.7%) in February.
 Out of all 797 cases reported during the years 2003 - 2018, the most belonged to the categories: Fire (40.4%), Hazardous Condition (34.4%), and Rescue & EMS (12.5%).
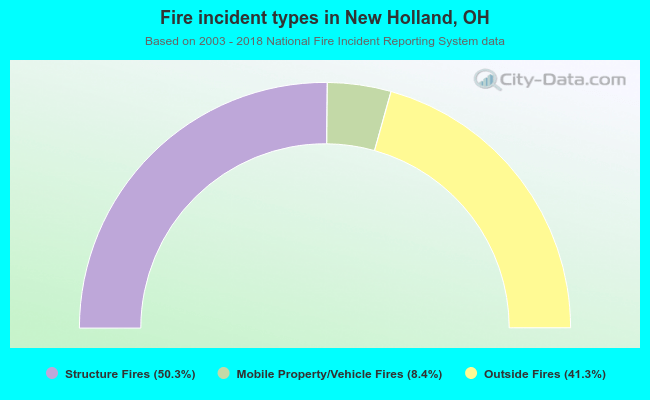 When looking into fire subcategories, the most incidents belonged to: Structure Fires (50.3%), and Outside Fires (41.3%).