| Fire incidents reported |
|---|
| Sreet name | Count |
|---|
| OLD STATE ROUTE 1 | 8 | | NEIL BEARD ROAD | 6 | | SCEPTER ROAD | 6 | | 130 HARBOR CIRCLE | 4 | | 3847 OLD STATE ROUTE 1 | 4 | | 542 ASHE AVE | 4 | | 751 ARROWHEAD | 4 | | 795 FOOTE LANE | 4 | | ASHE AVE | 4 | | BOX HOLLOW ROAD | 4 | | FLATWOOD ROAD | 4 | | HIGHWAY 70 | 4 | | HWY 70 | 4 | | HWY 70 WEST | 4 | | LADD LANE | 4 | | LONG ST | 4 | | OLD STATE ROUTE 1 RD | 4 | | PUMP STATION ROAD | 4 | | SOUTH LONG ST | 4 | | WELLS LOOP | 4 | | 10378 OLD STATE ROUTE 1 | 2 | | 10378 OLD STATE RT. 1 | 2 | | 1070 BOX HOLLOW RD. | 2 | | 10719 OLD STATE RT 1 | 2 | | 110 BOX LN | 2 |
| | | Fire incidents reported |
|---|
| Sreet name | Count |
|---|
| 1196 PUMP STATION ROAD | 2 | | 121 COKE LANE | 2 | | 1308 ASBURY DR. | 2 | | 1332 PUMP STATION ROD | 2 | | 1351 BROADWAY AVE. | 2 | | 1351 PUMPKIN CREEK | 2 | | 1385 GORMAN LOOP | 2 | | 139 SHAVER LN | 2 | | 1420 PUMP STATION ROAD | 2 | | 1493 FLATWOOD ROAD | 2 | | 154 HAROR CIRCLE | 2 | | 169 HICKMAN RD | 2 | | 169 HICKMAN ROAD | 2 | | 169 MCNEIL LANE | 2 | | 170 HUGHES HOLLOW ROAD | 2 | | 178 BOX HOLLOW ROAD | 2 | | 1829 HICKMAN ROAD | 2 | | 1843 LONG ST | 2 | | 200 MILL RD. | 2 | | 200 WELLS LOOP RD | 2 | | 201 LONG ST | 2 | | 2047 LONG ST | 2 | | 207 FISH HOOK | 2 | | 207 SUNSET DRIVE | 2 | | |
|
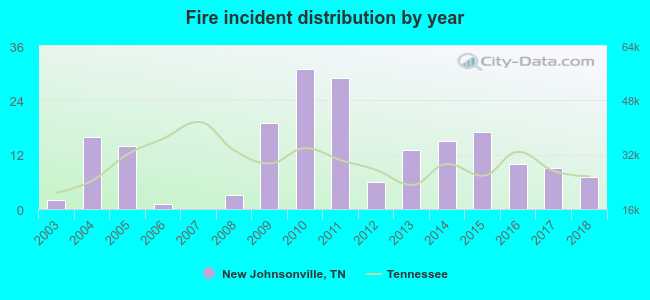 According to the data from the years 2003 - 2018 the average number of fires per year is 12. The highest number of reported fires - 31 took place in 2010, and the least - 0 in 2007. The data has a growing trend.
 30.7% incidents where reported in the morning and 69.3% in the evening. The most fires (17.2%) took place on Wednesday, and the least (11.5%) on Tuesday.
 According to the 192 fires from years 2003 - 2018 most fires (17.7%) took place during April, and the least (3.6%) in November.
 Out of all 481 cases reported during the years 2003 - 2018, the most belonged to the categories: Fire (39.9%), Overpressure Rupture (24.1%), and Rescue & EMS (19.3%).
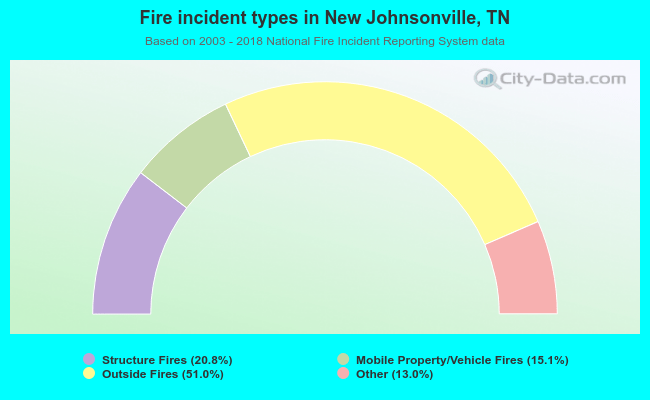 When looking into fire subcategories, the most incidents belonged to: Outside Fires (51.0%), and Structure Fires (20.8%).