New Roads: Fire Incidents, Louisiana (LA)
Where are fire incidents reported in New Roads, LA
Something went wrong! Please refresh the page.
|
| |||||||||||||||||||||||||||||||||||||||||||||||||||||||||||||||||||||||||||||||||||||||||||||||||||||||||||||
2002 - 2018 National Fire Incident Reporting System (NFIRS) incidents
- Incident types reported to NFIRS in New Roads, LA
- 96255.7%Rescue & EMS
- 42224.4%Fire
- 1227.1%False Alarm
- 1116.4%Good Intent Call
- 724.2%Hazardous Condition
- 301.7%Service Call
- 60.3%Special Incident
- 30.2%Overpressure Rupture
- Fire incident types reported to NFIRS in New Roads, LA
- 21851.7%Structure Fires
- 11727.7%Outside Fires
- 6114.5%Mobile Property/Vehicle Fires
- 266.2%Other
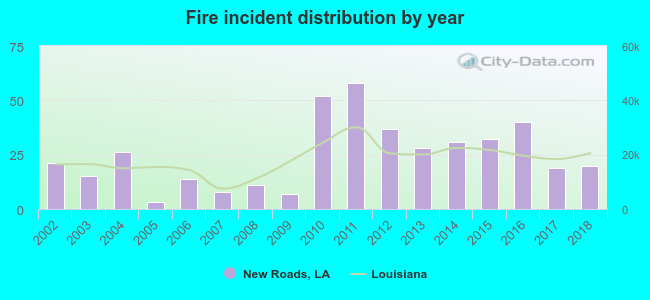 Based on the data from the years 2002 - 2018 the average number of fires per year is 25. The highest number of reported fire incidents - 58 took place in 2011, and the least - 3 in 2005. The data has a declining trend.
 According to the data from the years 2002 - 2018 the average number of fire-related casualties per year is 1. The highest number of reported injuries - 5 took place in 2010, and the lowest - 0 in 2002. The data has a constant trend.
 31.5% incidents where reported in the morning and 68.5% in the evening. The most fires (17.8%) took place on Friday, and the least (12.3%) on Monday.
 According to the 422 fire incidents from years 2002 - 2018 most fires (11.1%) took place during March, and the least (5.5%) in February.
 Out of all 1,728 cases reported during the years 2002 - 2018, the most belonged to the categories: Rescue & EMS (55.7%), Fire (24.4%), and False Alarm (7.1%).
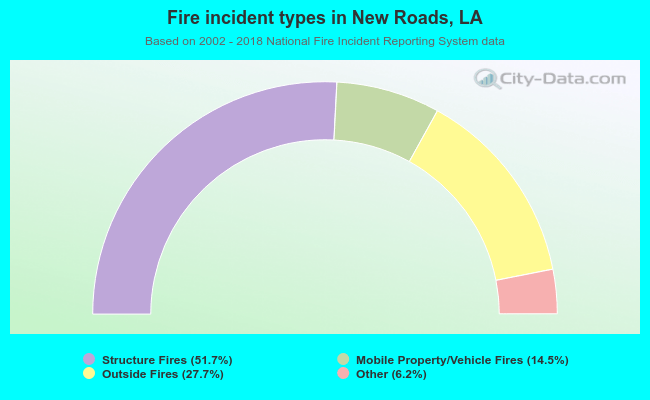 When looking into fire subcategories, the most reports belonged to: Structure Fires (51.7%), and Outside Fires (27.7%).