New York Mills: Fire Incidents, Minnesota (MN)
Where are fire incidents reported in New York Mills, MN
Something went wrong! Please refresh the page.
|
| |||||||||||||||||||||||||||||||||||||||||||||||||||||||||||||||||||||||||||||||||||||||||||||||||||||||||||||
2002 - 2018 National Fire Incident Reporting System (NFIRS) incidents
- Incident types reported to NFIRS in New York Mills, MN
- 68362.5%Rescue & EMS
- 32429.7%Fire
- 383.5%False Alarm
- 222.0%Hazardous Condition
- 121.1%Service Call
- 111.0%Good Intent Call
- 20.2%Overpressure Rupture
- Fire incident types reported to NFIRS in New York Mills, MN
- 15547.8%Structure Fires
- 11334.9%Outside Fires
- 299.0%Mobile Property/Vehicle Fires
- 278.3%Other
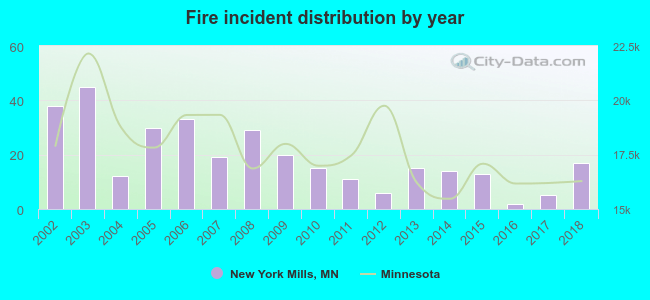 According to the data from the years 2002 - 2018 the average number of fire incidents per year is 19. The highest number of fires - 45 took place in 2003, and the least - 2 in 2016. The data has a dropping trend.
 34.0% incidents where reported in the morning and 66.0% in the evening. The most fires (17.3%) took place on Saturday, and the least (11.7%) on Tuesday.
 According to the 324 fires from years 2002 - 2018 most fires (15.7%) took place during April, and the least (1.9%) in September.
 Out of all 1,092 cases reported during the years 2002 - 2018, the most belonged to the categories: Rescue & EMS (62.5%), Fire (29.7%), and False Alarm (3.5%).
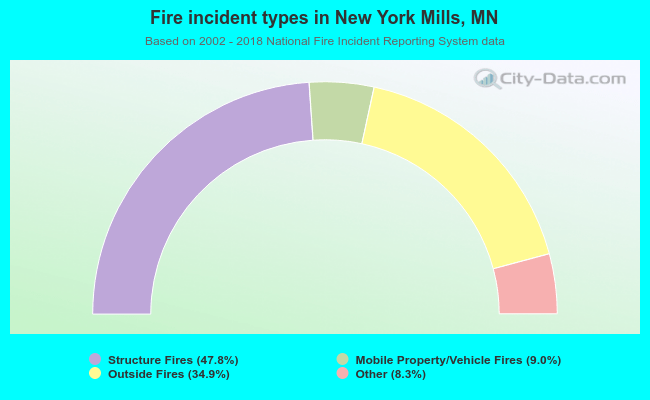 When looking into fire subcategories, the most reports belonged to: Structure Fires (47.8%), and Outside Fires (34.9%).