Newaygo: Fire Incidents, Michigan (MI)
Where are fire incidents reported in Newaygo, MI
Something went wrong! Please refresh the page.
|
| |||||||||||||||||||||||||||||||||||||||||||||||||||||||||||||||||||||||||||||||||||||||||||||||||||||||||||||
| Other | 145 | |||||||||||||||||||||||||||||||||||||||||||||||||||||||||||||||||||||||||||||||||||||||||||||||||||||||||||||
2002 - 2018 National Fire Incident Reporting System (NFIRS) incidents
- Incident types reported to NFIRS in Newaygo, MI
- 1,52146.6%Rescue & EMS
- 89527.4%Fire
- 50415.5%Hazardous Condition
- 1865.7%Good Intent Call
- 732.2%False Alarm
- 692.1%Service Call
- 60.2%Severe Weather
- 40.1%Overpressure Rupture
- 40.1%Special Incident
- Fire incident types reported to NFIRS in Newaygo, MI
- 41546.4%Structure Fires
- 36240.4%Outside Fires
- 899.9%Mobile Property/Vehicle Fires
- 293.2%Other
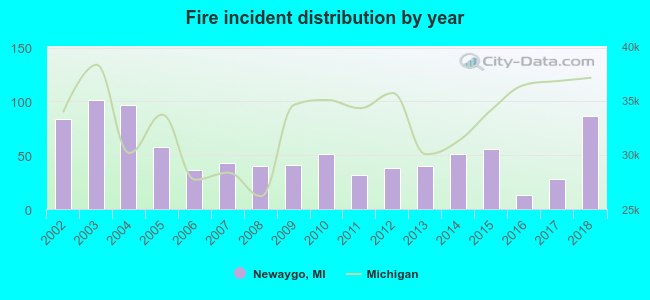 According to the data from the years 2002 - 2018 the average number of fire incidents per year is 53. The highest number of reported fires - 101 took place in 2003, and the least - 13 in 2016. The data has a rising trend.
 The median response time based on all reported fire incidents is 9 minutes. This is higher compared to the state median value.
The median response time in Newaygo, MI compared to nearest cities:
(Note: Based on data for all years, including only cities with at least 500 fire incidents)
| Newaygo: | 9 minutes |
| Grant: | 10 minutes |
| Fremont: | 9 minutes |
| White Cloud: | 11 minutes |
| Cedar Springs: | 7 minutes |
| Sparta: | 7 minutes |
| Twin Lake: | 10 minutes |
| Rockford: | 6 minutes |
| Big Rapids: | 8 minutes |
 27.2% incidents where reported in the morning and 72.8% in the evening. The most fires (17.2%) took place on Monday, and the least (11.7%) on Thursday.
 Based on the 895 incident reports from years 2002 - 2018 most fires (17.7%) took place during April, and the least (4.5%) in November.
 Out of all 3,262 cases reported during the years 2002 - 2018, the most belonged to the categories: Rescue & EMS (46.6%), Fire (27.4%), and Hazardous Condition (15.5%).
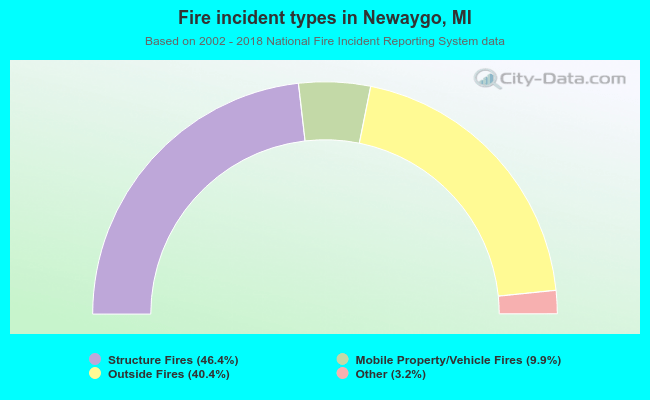 When looking into fire subcategories, the most reports belonged to: Structure Fires (46.4%), and Outside Fires (40.4%).