Newcastle: Fire Incidents, Washington (WA)
Where are fire incidents reported in Newcastle, WA
Something went wrong! Please refresh the page.
|
| |||||||||||||||||||||||||||||||||||||||||||||||||||||||||||||||||||||||||||||||||||||||||||||||||||||||||||||
2002 - 2018 National Fire Incident Reporting System (NFIRS) incidents
- Incident types reported to NFIRS in Newcastle, WA
- 3,06767.9%Rescue & EMS
- 3948.7%False Alarm
- 3197.1%Fire
- 2826.2%Service Call
- 2565.7%Good Intent Call
- 1844.1%Hazardous Condition
- 100.2%Severe Weather
- Fire incident types reported to NFIRS in Newcastle, WA
- 15849.5%Outside Fires
- 12438.9%Structure Fires
- 3210.0%Mobile Property/Vehicle Fires
- 51.6%Other
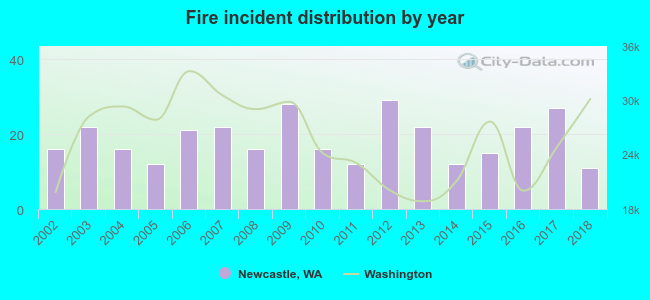 Based on the data from the years 2002 - 2018 the average number of fires per year is 19. The highest number of fire incidents - 29 took place in 2012, and the least - 11 in 2018. The data has a decreasing trend.
The average number of yearly fire incidents per 10k residents in Newcastle, WA compared to nearest cities:
(Note: Based on data for the last 3 years, including only cities with population 5,000 and above)
| Newcastle: | 17.9 |
| Renton: | 52.4 |
| Mercer Island: | 12.1 |
| Bellevue: | 26.4 |
| Issaquah: | 26.1 |
| Tukwila: | 102.1 |
| Sammamish: | 11.3 |
| SeaTac: | 44.2 |
| Burien: | 39.4 |
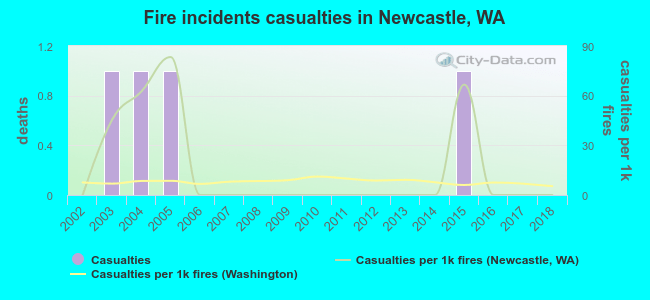 Based on the data from the years 2002 - 2018 the average number of fire-related yearly casualties is 0. The highest number of reported injuries - 1 took place in 2003, and the lowest - 0 in 2002. The data has a constant trend.
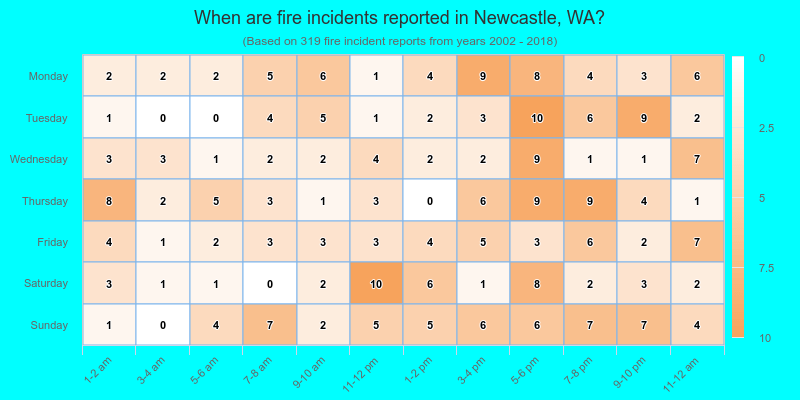
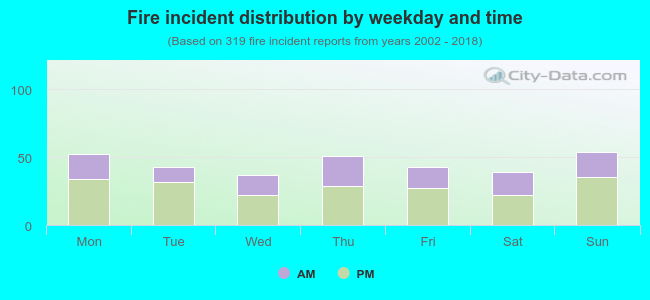 37.0% incidents where reported in the morning and 63.0% in the evening. The most fires (16.9%) took place on Sunday, and the least (11.6%) on Wednesday.
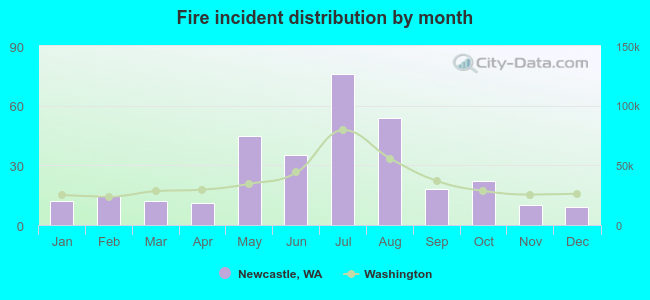 Based on the 319 fire incidents from years 2002 - 2018 most fires (23.8%) took place during July, and the least (2.8%) in December.
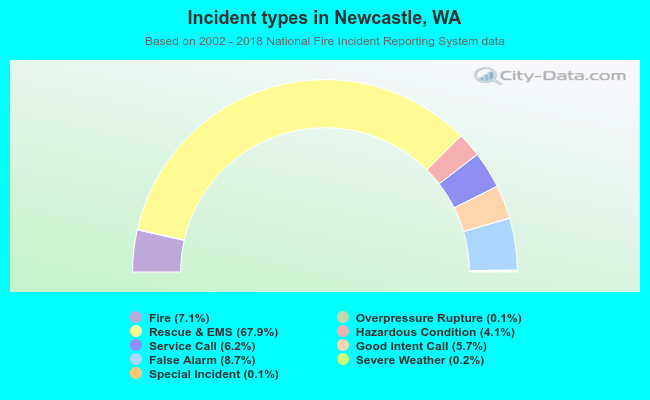 Out of all 4,519 cases reported during the years 2002 - 2018, the most belonged to the categories: Rescue & EMS (67.9%), False Alarm (8.7%), and Fire (7.1%).
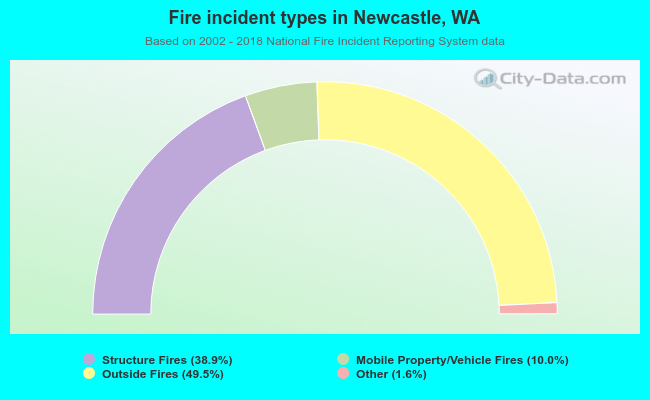 When looking into fire subcategories, the most reports belonged to: Outside Fires (49.5%), and Structure Fires (38.9%).