North Augusta: Fire Incidents, South Carolina (SC)
Where are fire incidents reported in North Augusta, SC
Something went wrong! Please refresh the page.
| Fire incidents reported | |
|---|---|
| Sreet name | Count |
| MARTINTOWN RD | 76 |
| EDGEFIELD RD | 66 |
| KNOX AVE | 42 |
| CHEROKEE DR | 38 |
| JEFFERSON DAVIS HWY | 36 |
| GEORGIA AVE | 28 |
| INTERSTATE 20 | 28 |
| SWEETWATER RD | 26 |
| BRADLEYVILLE RD | 24 |
| FIVE NOTCH RD | 24 |
| GEORGIA AVE. | 24 |
| MURRAH RD | 24 |
| RIDGE RD | 22 |
| STEPHENS RD | 22 |
| ATOMIC RD. | 20 |
| BUENA VISTA AVE | 18 |
| CHALET NORTH CT | 18 |
| E. MARTINTOWN RD. | 18 |
| KNOX AVE. | 18 |
| OLD SUDLOW LAKE RD | 18 |
| WESTON ST | 18 |
| ATOMIC RD | 16 |
| EDGEFIELD RD. | 16 |
| MARTINTOWN RD. | 16 |
| MOORE RD | 16 |
| SPRINGHAVEN DR | 16 |
| BELVEDERECLEARWATER RD | 14 |
| CORLEY DR | 14 |
| MARTINTOWN RD. RD | 14 |
| WEST AVE | 14 |
| Other | 1,165 |
2003 - 2018 National Fire Incident Reporting System (NFIRS) incidents
- Incident types reported to NFIRS in North Augusta, SC
- 1,90941.7%Fire
- 1,13324.7%Rescue & EMS
- 57412.5%Good Intent Call
- 49610.8%Hazardous Condition
- 1763.8%False Alarm
- 1603.5%Service Call
- 1242.7%Severe Weather
- 80.2%Overpressure Rupture
- Fire incident types reported to NFIRS in North Augusta, SC
- 75939.8%Outside Fires
- 69336.3%Structure Fires
- 32417.0%Mobile Property/Vehicle Fires
- 1337.0%Other
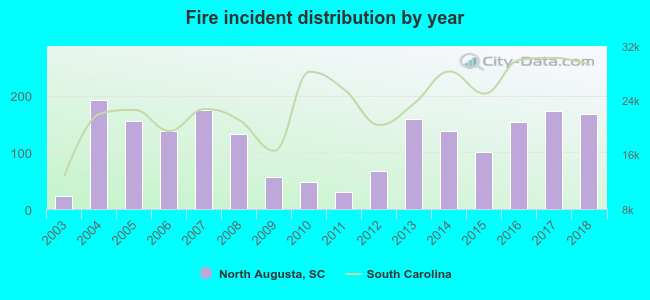 According to the data from the years 2003 - 2018 the average number of fires per year is 119. The highest number of reported fires - 192 took place in 2004, and the least - 23 in 2003. The data has a rising trend.
The average number of yearly fire incidents per 10k residents in North Augusta, SC compared to nearest cities:
(Note: Based on data for the last 3 years, including only cities with population 5,000 and above)
| North Augusta: | 73.8 |
| Belvedere: | 90.9 |
| Beech Island: | 77.9 |
| Aiken: | 82.3 |
 The median response time based on all reported fire incidents is 5 minutes. This is lower than the South Carolina median value.
The median response time in North Augusta, SC compared to nearest cities:
(Note: Based on data for all years, including only cities with at least 500 fire incidents)
| North Augusta: | 5 minutes |
| Belvedere: | 8 minutes |
| Augusta: | 5 minutes |
| Beech Island: | 9 minutes |
| Martinez: | 5 minutes |
| Graniteville: | 9 minutes |
| Evans: | 5 minutes |
| Aiken: | 4 minutes |
| Grovetown: | 5 minutes |
 Based on the reports from the years 2003 - 2018 the average number of fire-related yearly deaths is 0. The highest number of deaths - 2 took place in 2005, and the lowest - 0 in 2003. The data has a rising trend.
 According to the data from the years 2003 - 2018 the average number of fire-related casualties per year is 1. The highest number of casualties - 3 took place in 2013, and the lowest - 0 in 2003. The data has a growing trend.
The average number of casualties per 1,000 fire incidents is 5. This indicator was the highest - 30 in 2015, and the lowest 0 in 2003. The trend for casualties per 1,000 fire incidents is growing. Compared to the South Carolina value the number of casualties per 1,000 fire incidents is lower.
According to the data from the years 2003 - 2018 the average number of fire-related casualties per year is 1. The highest number of casualties - 3 took place in 2013, and the lowest - 0 in 2003. The data has a growing trend.
The average number of casualties per 1,000 fire incidents is 5. This indicator was the highest - 30 in 2015, and the lowest 0 in 2003. The trend for casualties per 1,000 fire incidents is growing. Compared to the South Carolina value the number of casualties per 1,000 fire incidents is lower.Casualties per 1,000 incidents in North Augusta, SC compared to nearest cities:
(Note: Based on data for all years, including only cities with at least 500 fire incidents)
| North Augusta: | 5.8 |
| Belvedere: | 1.3 |
| Augusta: | 18.7 |
| Beech Island: | 3.2 |
| Martinez: | 1.3 |
| Graniteville: | 10.1 |
| Evans: | 8.0 |
| Aiken: | 16.8 |
| Grovetown: | 9.5 |
 28.0% incidents where reported in the morning and 72.0% in the evening. The most fires (14.9%) took place on Wednesday, and the least (13.3%) on Thursday.
 Based on the 1,909 reports from years 2003 - 2018 most fires (10.7%) took place during March, and the least (6.3%) in September.
 Out of all 4,582 cases reported during the years 2003 - 2018, the most belonged to the categories: Fire (41.7%), Rescue & EMS (24.7%), and Good Intent Call (12.5%).
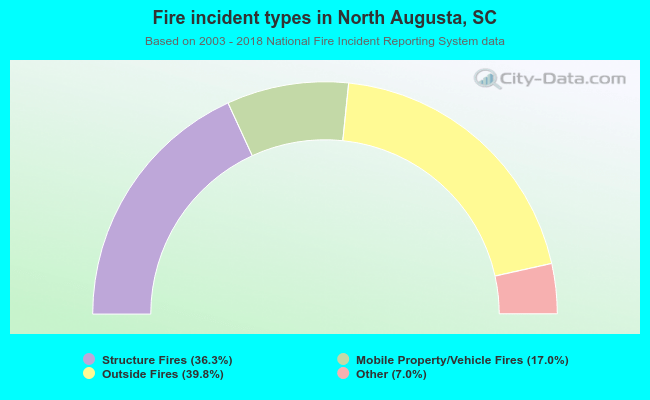 When looking into fire subcategories, the most incidents belonged to: Outside Fires (39.8%), and Structure Fires (36.3%).