North Bethesda: Fire Incidents, Maryland (MD)
Where are fire incidents reported in North Bethesda, MD
Something went wrong! Please refresh the page.
|
| |||||||||||||||||||||||||||||||||||||||||||||||||||||||||||||||||||||||||||||||||||||||||||||||||||||||||||||
2007 - 2017 National Fire Incident Reporting System (NFIRS) incidents
- Incident types reported to NFIRS in North Bethesda, MD
- 3,72467.5%Rescue & EMS
- 59710.8%Good Intent Call
- 4057.3%Service Call
- 3516.4%False Alarm
- 3075.6%Hazardous Condition
- 1232.2%Fire
- 100.2%Overpressure Rupture
- Fire incident types reported to NFIRS in North Bethesda, MD
- 6048.8%Structure Fires
- 3629.3%Outside Fires
- 2621.1%Mobile Property/Vehicle Fires
- 10.8%Other
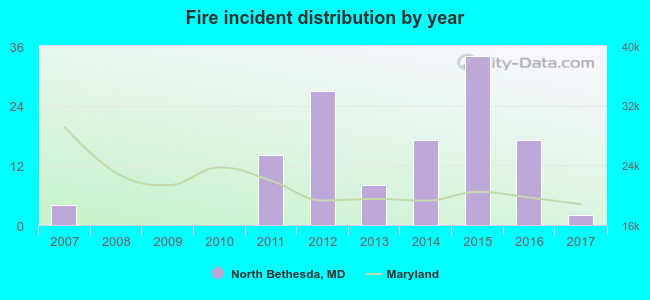 Based on the data from the years 2007 - 2017 the average number of fires per year is 11. The highest number of reported fire incidents - 34 took place in 2015, and the least - 0 in 2008. The data has a decreasing trend.
The average number of yearly fire incidents per 10k residents in North Bethesda, MD compared to nearest cities:
(Note: Based on data for the last 3 years, including only cities with population 5,000 and above)
| North Bethesda: | 2.2 |
| Rockville: | 18.6 |
| Bethesda: | 13.1 |
| Potomac: | 9.3 |
| Silver Spring: | 44.6 |
| Colesville: | 14.3 |
| Takoma Park: | 14.0 |
| Olney: | 6.5 |
| Adelphi: | 1.1 |

 37.4% incidents where reported in the morning and 62.6% in the evening. The most fires (19.5%) took place on Saturday, and the least (9.8%) on Thursday.
 According to the 123 fire incidents from years 2007 - 2017 most fires (17.9%) took place during September, and the least (0.8%) in July.
 Out of all 5,521 cases reported during the years 2007 - 2017, the most belonged to the categories: Rescue & EMS (67.5%), Good Intent Call (10.8%), and Service Call (7.3%).
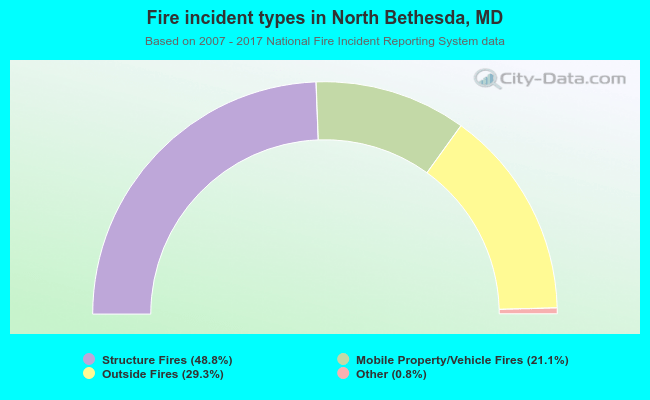 When looking into fire subcategories, the most reports belonged to: Structure Fires (48.8%), and Outside Fires (29.3%).