North Canton: Fire Incidents, Ohio (OH)
Where are fire incidents reported in North Canton, OH
Something went wrong! Please refresh the page.
| Fire incidents reported | |
|---|---|
| Sreet name | Count |
| EAST MAPLE | 212 |
| MASSILLON RD | 110 |
| INTERSTATE 77 | 102 |
| NORTH MAIN | 90 |
| APPLEGROVE | 56 |
| MAIN ST | 56 |
| LAUBY RD | 42 |
| 7TH | 40 |
| MAYFAIR RD | 40 |
| ARLINGTON RD | 38 |
| PORTAGE ST | 38 |
| SOUTH MAIN | 38 |
| STRIP AVE | 38 |
| WHIPPLE AVE | 36 |
| GREENSBURG RD | 34 |
| WEST MAPLE | 34 |
| BEECHWOOD | 32 |
| SUNSET STRIP AVE | 28 |
| PITTSBURG | 26 |
| PORTAGE | 24 |
| STRAUSSER ST | 24 |
| WISE RD | 24 |
| APPLEGROVE ST | 16 |
| DRESSLER RD | 16 |
| EVERHARD | 16 |
| EVERHARD RD | 16 |
| MAPLE ST | 16 |
| STATE ST | 16 |
| CLEVELAND AVE | 14 |
| CLEVELAND AVE | 14 |
| Other | 236 |
2002 - 2018 National Fire Incident Reporting System (NFIRS) incidents
- Incident types reported to NFIRS in North Canton, OH
- 14,61263.4%Rescue & EMS
- 2,1589.4%Service Call
- 1,9438.4%Hazardous Condition
- 1,7317.5%False Alarm
- 1,5226.6%Fire
- 9384.1%Good Intent Call
- 910.4%Severe Weather
- 250.1%Overpressure Rupture
- Fire incident types reported to NFIRS in North Canton, OH
- 75949.9%Structure Fires
- 43428.5%Outside Fires
- 31820.9%Mobile Property/Vehicle Fires
- 110.7%Other
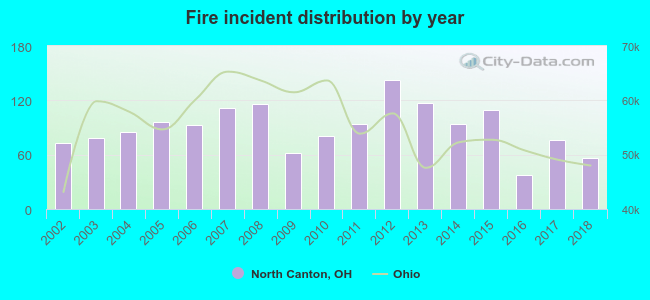 According to the data from the years 2002 - 2018 the average number of fires per year is 90. The highest number of fires - 143 took place in 2012, and the least - 37 in 2016. The data has a decreasing trend.
The average number of yearly fire incidents per 10k residents in North Canton, OH compared to nearest cities:
(Note: Based on data for the last 3 years, including only cities with population 5,000 and above)
| North Canton: | 32.2 |
| Canton: | 54.2 |
| Green: | 0.6 |
| Louisville: | 68.5 |
| Massillon: | 27.6 |
| Canal Fulton: | 32.8 |
| Barberton: | 18.0 |
| Akron: | 43.8 |
| Tallmadge: | 28.1 |
 The median response time based on all reported fire incidents is 6 minutes. This is comparable to the state median value.
The median response time in North Canton, OH compared to nearest cities:
(Note: Based on data for all years, including only cities with at least 500 fire incidents)
| North Canton: | 6 minutes |
| Canton: | 5 minutes |
| Hartville: | 8 minutes |
| Uniontown: | 5 minutes |
| Louisville: | 8 minutes |
| Massillon: | 5 minutes |
| East Canton: | 10 minutes |
| Canal Fulton: | 8 minutes |
| Navarre: | 10 minutes |
 According to the reports from the years 2002 - 2018 the average number of fire-related casualties per year is 2. The highest number of casualties - 12 took place in 2011, and the lowest - 0 in 2003. The data has a decreasing trend.
The average number of casualties per 1,000 fires is 22. This indicator was the highest - 128 in 2011, and the lowest 0 in 2003. The trend for injuries per 1,000 incidents is declining. Compared to the state value the number of casualties per 1,000 fires is higher.
According to the reports from the years 2002 - 2018 the average number of fire-related casualties per year is 2. The highest number of casualties - 12 took place in 2011, and the lowest - 0 in 2003. The data has a decreasing trend.
The average number of casualties per 1,000 fires is 22. This indicator was the highest - 128 in 2011, and the lowest 0 in 2003. The trend for injuries per 1,000 incidents is declining. Compared to the state value the number of casualties per 1,000 fires is higher.Casualties per 1,000 incidents in North Canton, OH compared to nearest cities:
(Note: Based on data for all years, including only cities with at least 500 fire incidents)
| North Canton: | 22.3 |
| Canton: | 23.7 |
| Hartville: | 10.8 |
| Uniontown: | 15.0 |
| Louisville: | 9.4 |
| Massillon: | 13.5 |
| East Canton: | 14.8 |
| Canal Fulton: | 5.5 |
| Navarre: | 9.2 |
 28.8% incidents where reported in the morning and 71.2% in the evening. The most fires (16.2%) took place on Sunday, and the least (12.7%) on Wednesday.
 Based on the 1,522 incident reports from years 2002 - 2018 most fires (10.3%) took place during August, and the least (6.6%) in December.
 Out of all 23,031 cases reported during the years 2002 - 2018, the most belonged to the categories: Rescue & EMS (63.4%), Service Call (9.4%), and Hazardous Condition (8.4%).
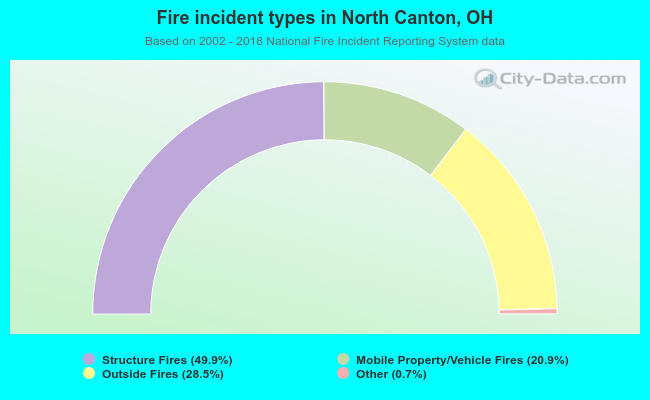 When looking into fire subcategories, the most incidents belonged to: Structure Fires (49.9%), and Outside Fires (28.5%).