North Lawrence: Fire Incidents, Ohio (OH)
Where are fire incidents reported in North Lawrence, OH
Something went wrong! Please refresh the page.
|
| |||||||||||||||||||||||||||||||||||||||||||||||||||||||||||||||||||||||||||||||||||||||||||||||||||||||||||||
2002 - 2018 National Fire Incident Reporting System (NFIRS) incidents
- Incident types reported to NFIRS in North Lawrence, OH
- 78254.5%Rescue & EMS
- 26218.3%Fire
- 17011.8%Service Call
- 1208.4%Hazardous Condition
- 543.8%Good Intent Call
- 282.0%False Alarm
- 100.7%Severe Weather
- 90.6%Special Incident
- Fire incident types reported to NFIRS in North Lawrence, OH
- 12648.1%Structure Fires
- 10439.7%Outside Fires
- 269.9%Mobile Property/Vehicle Fires
- 62.3%Other
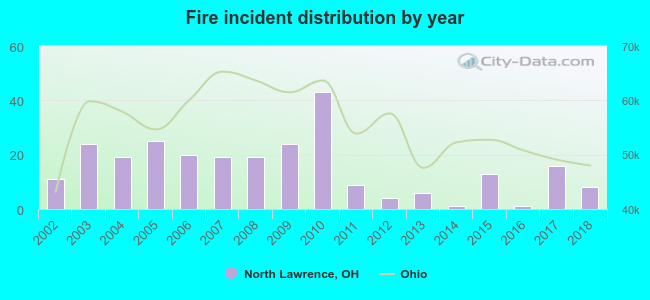 According to the data from the years 2002 - 2018 the average number of fires per year is 15. The highest number of fires - 43 took place in 2010, and the least - 1 in 2014. The data has a decreasing trend.
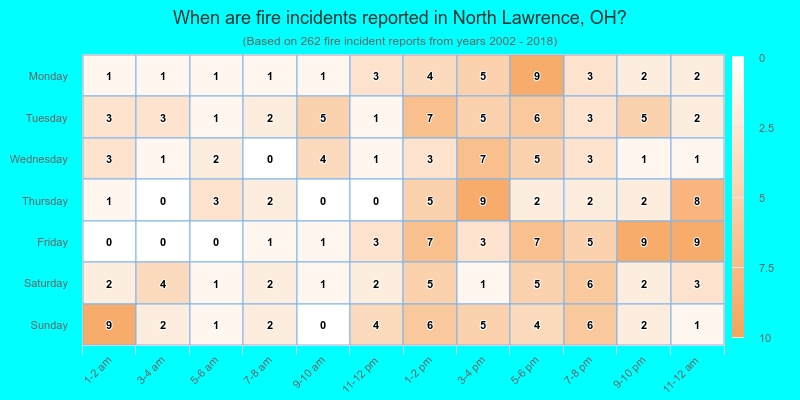
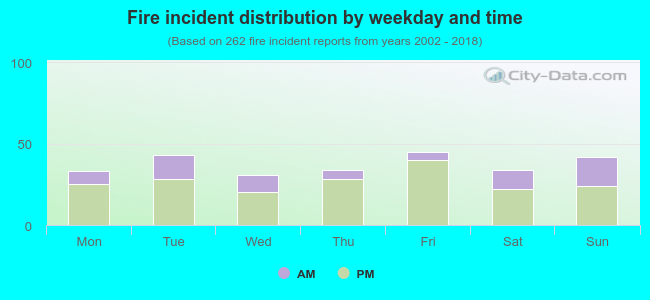 28.6% incidents where reported in the morning and 71.4% in the evening. The most fires (17.2%) took place on Friday, and the least (11.8%) on Wednesday.
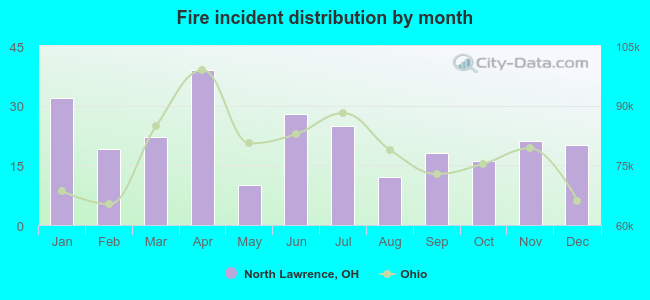 Based on the 262 fire incident reports from years 2002 - 2018 most fires (14.9%) took place during April, and the least (3.8%) in May.
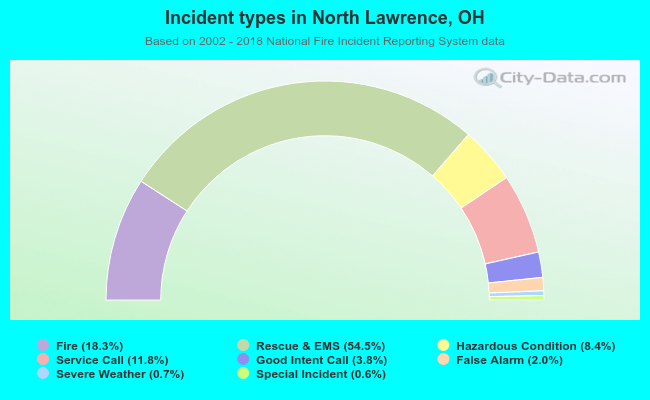 Out of all 1,435 cases reported during the years 2002 - 2018, the most belonged to the categories: Overpressure Rupture (54.5%), Fire (18.3%), and Hazardous Condition (11.8%).
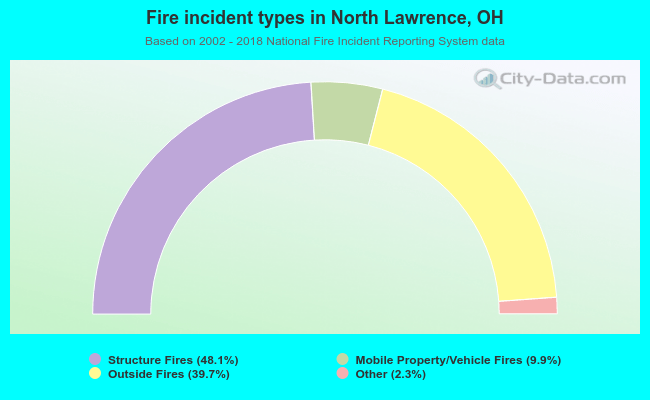 When looking into fire subcategories, the most reports belonged to: Structure Fires (48.1%), and Outside Fires (39.7%).