Northfield: Fire Incidents, Illinois (IL)
Where are fire incidents reported in Northfield, IL
Something went wrong! Please refresh the page.
|
| |||||||||||||||||||||||||||||||||||||||||||||||||||||||||||||||||||||||||||||||||||||||||||||||||||||||||||||
2002 - 2017 National Fire Incident Reporting System (NFIRS) incidents
- Incident types reported to NFIRS in Northfield, IL
- 1,21632.1%Rescue & EMS
- 1,15930.6%Good Intent Call
- 41611.0%Service Call
- 40110.6%Hazardous Condition
- 3509.2%False Alarm
- 2376.3%Fire
- 40.1%Severe Weather
- Fire incident types reported to NFIRS in Northfield, IL
- 14159.5%Structure Fires
- 5121.5%Mobile Property/Vehicle Fires
- 2912.2%Outside Fires
- 166.8%Other
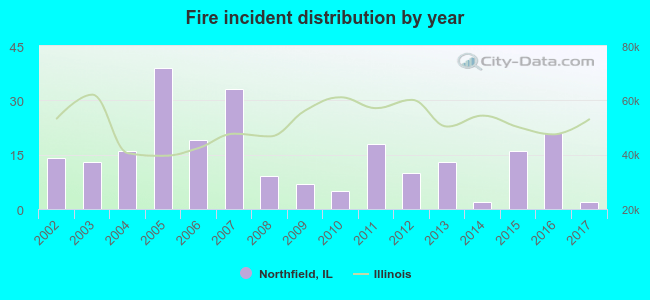 According to the data from the years 2002 - 2017 the average number of fires per year is 15. The highest number of fires - 39 took place in 2005, and the least - 2 in 2014. The data has a dropping trend.
The average number of yearly fire incidents per 10k residents in Northfield, IL compared to nearest cities:
(Note: Based on data for the last 3 years, including only cities with population 5,000 and above)
| Northfield: | 21.0 |
| Winnetka: | 20.8 |
| Glencoe: | 7.8 |
| Glenview: | 16.3 |
| Wilmette: | 19.7 |
| Northbrook: | 21.9 |
| Morton Grove: | 14.8 |
| Skokie: | 12.6 |
| Niles: | 20.0 |

 32.5% incidents where reported in the morning and 67.5% in the evening. The most fires (19.0%) took place on Saturday, and the least (11.4%) on Sunday.
 According to the 237 fire incident reports from years 2002 - 2017 most fires (12.7%) took place during September, and the least (4.6%) in October.
 Out of all 3,787 cases reported during the years 2002 - 2017, the most belonged to the categories: Rescue & EMS (32.1%), Good Intent Call (30.6%), and Service Call (11.0%).
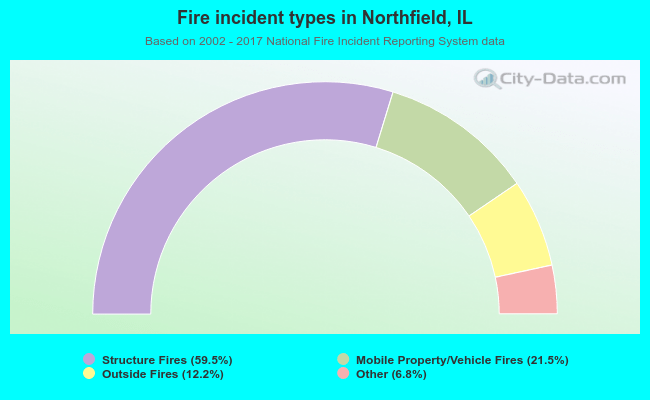 When looking into fire subcategories, the most reports belonged to: Structure Fires (59.5%), and Mobile Property/Vehicle Fires (21.5%).