Norwalk: Fire Incidents, Iowa (IA)
Where are fire incidents reported in Norwalk, IA
Something went wrong! Please refresh the page.
|
| |||||||||||||||||||||||||||||||||||||||||||||||||||||||||||||||||||||||||||||||||||||||||||||||||||||||||||||
2002 - 2017 National Fire Incident Reporting System (NFIRS) incidents
- Incident types reported to NFIRS in Norwalk, IA
- 45048.3%Rescue & EMS
- 19921.4%Fire
- 9810.5%Service Call
- 818.7%Hazardous Condition
- 586.2%False Alarm
- 424.5%Good Intent Call
- 20.2%Overpressure Rupture
- 10.1%Severe Weather
- Fire incident types reported to NFIRS in Norwalk, IA
- 9045.2%Outside Fires
- 6532.7%Structure Fires
- 2311.6%Mobile Property/Vehicle Fires
- 2110.6%Other
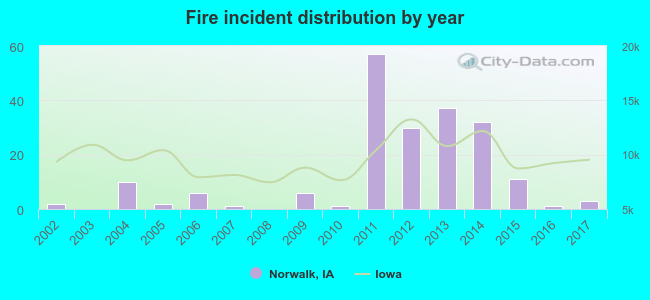 Based on the data from the years 2002 - 2017 the average number of fire incidents per year is 12. The highest number of fire incidents - 57 took place in 2011, and the least - 0 in 2003. The data has an increasing trend.
The average number of yearly fire incidents per 10k residents in Norwalk, IA compared to nearest cities:
(Note: Based on data for the last 3 years, including only cities with population 5,000 and above)
| Norwalk: | 2.0 |
| West Des Moines: | 13.6 |
| Des Moines: | 20.0 |
| Clive: | 16.4 |
| Indianola: | 7.6 |
| Urbandale: | 10.8 |
| Pleasant Hill: | 13.1 |
| Waukee: | 27.4 |
| Johnston: | 21.4 |
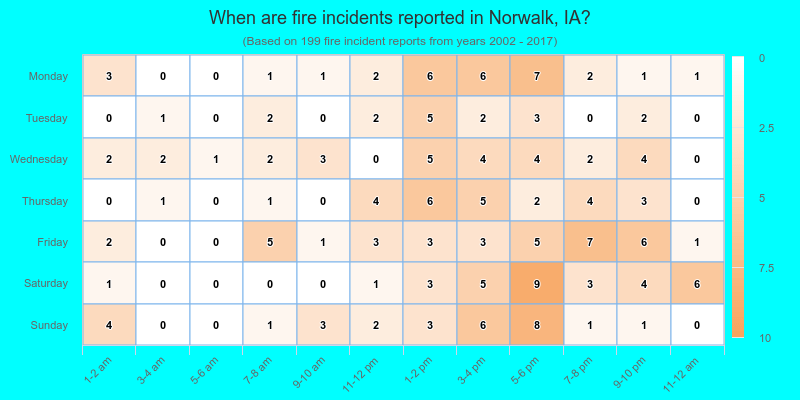
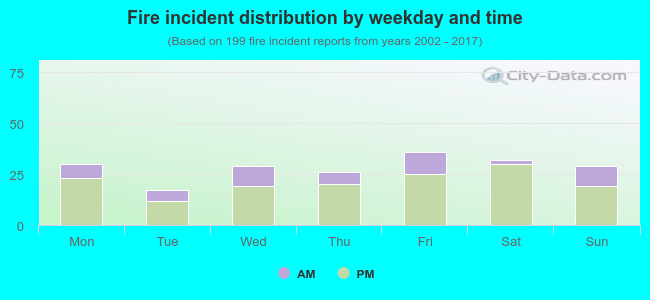 25.6% incidents where reported in the morning and 74.4% in the evening. The most fires (18.1%) took place on Friday, and the least (8.5%) on Tuesday.
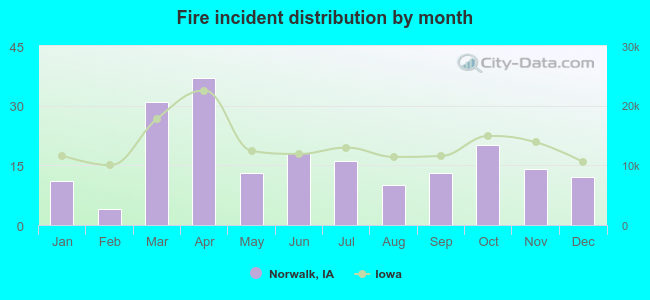 According to the 199 fire incidents from years 2002 - 2017 most fires (18.6%) took place during April, and the least (2.0%) in February.
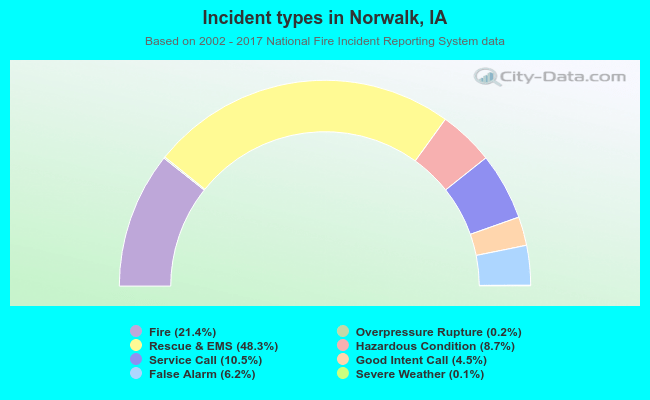 Out of all 931 cases reported during the years 2002 - 2017, the most belonged to the categories: Rescue & EMS (48.3%), Fire (21.4%), and Service Call (10.5%).
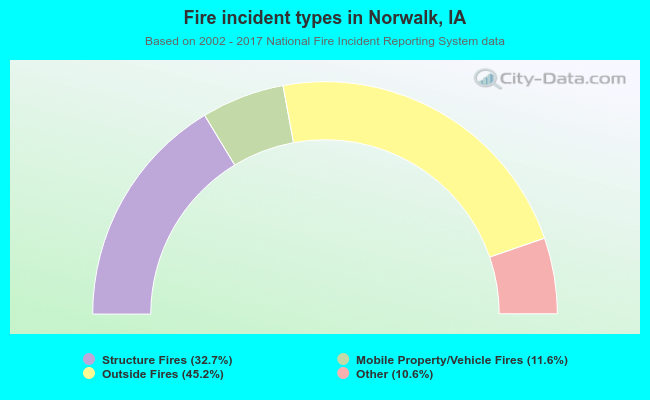 When looking into fire subcategories, the most incidents belonged to: Outside Fires (45.2%), and Structure Fires (32.7%).