| Fire incidents reported |
|---|
| Sreet name | Count |
|---|
| ALABAMA HIGHWAY 199 | 85 | | ALABAMA HIGHWAY 49 SOUTH | 55 | | ALABAMA HIGHWAY 199 HWY | 40 | | TALLAPOOSA STREET | 39 | | ALABAMA HIGHWAY 120 | 25 | | MACON COUNTY ROAD 37 | 25 | | NOTASULGA ROAD | 25 | | FORD ROAD | 20 | | MACON COUNTY ROAD 12 | 20 | | MACON COUNTY ROAD 12 RD | 20 | | MACON COUNTY ROAD 31 | 19 | | MACON COUNTY ROAD 60 | 15 | | COUNTY ROAD 37 | 13 | | 131 PLAINSTATION RD | 10 | | 2299 CO RD 37 | 10 | | 280 CO RD 31 | 10 | | ALABAMA HIGHWAY 81 | 10 | | BLOCK MACON COUNTY ROAD 60 | 10 | | COBB RD | 10 | | MACON COUNTY ROAD 35 | 10 | | CO RD 54 | 9 | | COUNTY ROAD 53 | 9 | | HWY 81 | 9 | | MACON COUNTY ROAD 54 WEST | 9 | | COBB ROAD RD | 8 |
| | | Fire incidents reported |
|---|
| Sreet name | Count |
|---|
| COUNTY RD. 77 RD | 8 | | COUNTY ROAD 60 RD | 8 | | COUNTY ROAD 77 RD | 8 | | CR 54 | 8 | | MACON COUNTY ROAD 37 RD | 8 | | TALLAPOOSA ST. ST | 8 | | TALLAPOOSA STREET ST | 8 | | 1/2 MILE EAST OF MACON CTY 77 | 5 | | 111 WHITMAN HILL ROAD | 5 | | 140 WOODLAND ROAD | 5 | | 1400 BLOCK TALLAPOOSA | 5 | | 1491 CO RD 60 | 5 | | 1500 BLOCK CO RD 55 | 5 | | 1565 CO RD 39 | 5 | | 170 CO RD 31 | 5 | | 1920 E MAIN | 5 | | 199 HWY | 5 | | 200-300 BLOCK IRONWOOD | 5 | | 2000 BLOCK CO RD 52 | 5 | | 2117 CO RD 57 | 5 | | 223 LOTIES DR | 5 | | 2500 BLK CO RD 31 | 5 | | 2745 LEE RD 393 | 5 | | 3000 BLK CO RD 59 | 5 | | 3499 CO RD 54 E | 5 |
|
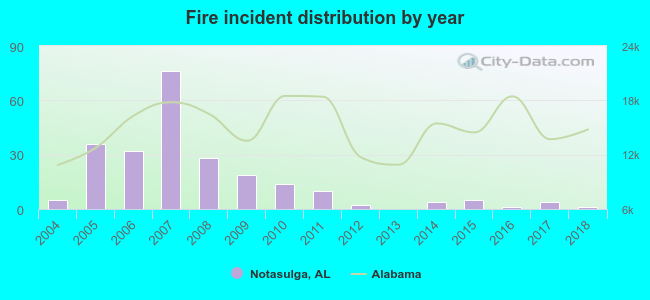 According to the data from the years 2004 - 2018 the average number of fires per year is 16. The highest number of fire incidents - 76 took place in 2007, and the least - 0 in 2013. The data has a decreasing trend.
 30.0% incidents where reported in the morning and 70.0% in the evening. The most fires (19.4%) took place on Saturday, and the least (10.1%) on Sunday.
 Based on the 237 incident reports from years 2004 - 2018 most fires (17.7%) took place during March, and the least (4.2%) in September.
 Out of all 311 cases reported during the years 2004 - 2018, the most belonged to the categories: Fire (76.2%), Overpressure Rupture (12.9%), and Rescue & EMS (6.1%).
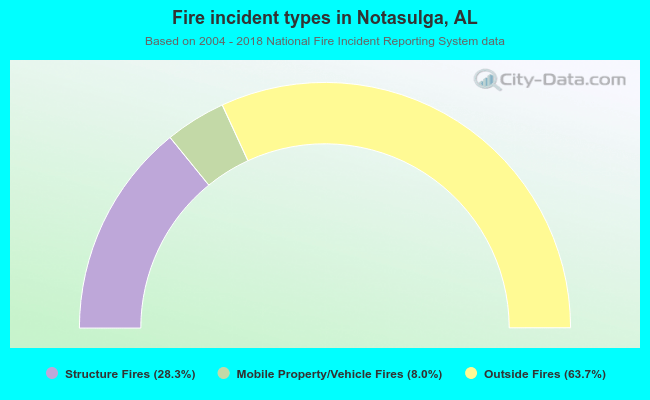 When looking into fire subcategories, the most reports belonged to: Outside Fires (63.7%), and Structure Fires (28.3%).