Oakridge: Fire Incidents, Oregon (OR)
Where are fire incidents reported in Oakridge, OR
Something went wrong! Please refresh the page.
|
| |||||||||||||||||||||||||||||||||||||||||||||||||||||||||||||||||||||||||||||||||||||||||||||||||||||||||||||
2002 - 2018 National Fire Incident Reporting System (NFIRS) incidents
- Incident types reported to NFIRS in Oakridge, OR
- 26767.4%Fire
- 6015.2%Good Intent Call
- 358.8%Hazardous Condition
- 215.3%Rescue & EMS
- 82.0%False Alarm
- 41.0%Service Call
- 10.3%Overpressure Rupture
- Fire incident types reported to NFIRS in Oakridge, OR
- 13249.4%Structure Fires
- 6524.3%Outside Fires
- 4115.4%Mobile Property/Vehicle Fires
- 2910.9%Other
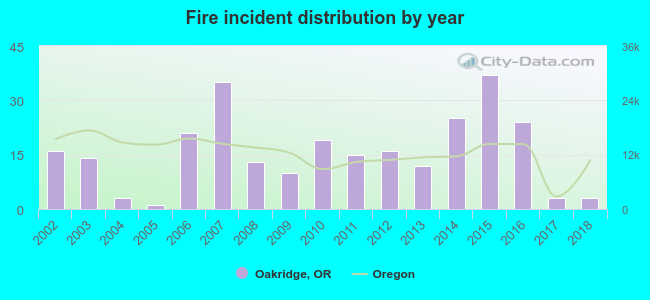 According to the data from the years 2002 - 2018 the average number of fires per year is 16. The highest number of reported fire incidents - 37 took place in 2015, and the least - 1 in 2005. The data has a dropping trend.
 34.8% incidents where reported in the morning and 65.2% in the evening. The most fires (17.6%) took place on Friday, and the least (9.4%) on Monday.
 Based on the 267 reports from years 2002 - 2018 most fires (13.5%) took place during July, and the least (4.1%) in December.
 Out of all 396 cases reported during the years 2002 - 2018, the most belonged to the categories: Fire (67.4%), Good Intent Call (15.2%), and Hazardous Condition (8.8%).
 When looking into fire subcategories, the most reports belonged to: Structure Fires (49.4%), and Outside Fires (24.3%).