Oakwood: Fire Incidents, Georgia (GA)
Where are fire incidents reported in Oakwood, GA
Something went wrong! Please refresh the page.
|
| |||||||||||||||||||||||||||||||||||||||||||||||||||||||||||||||||||||||||||||||||||||||||||||||||||||||||||||
2005 - 2018 National Fire Incident Reporting System (NFIRS) incidents
- Incident types reported to NFIRS in Oakwood, GA
- 3,82069.8%Rescue & EMS
- 63711.6%Good Intent Call
- 3205.9%Fire
- 3075.6%Service Call
- 2314.2%False Alarm
- 1442.6%Hazardous Condition
- 80.1%Severe Weather
- Fire incident types reported to NFIRS in Oakwood, GA
- 13642.5%Outside Fires
- 10633.1%Structure Fires
- 7824.4%Mobile Property/Vehicle Fires
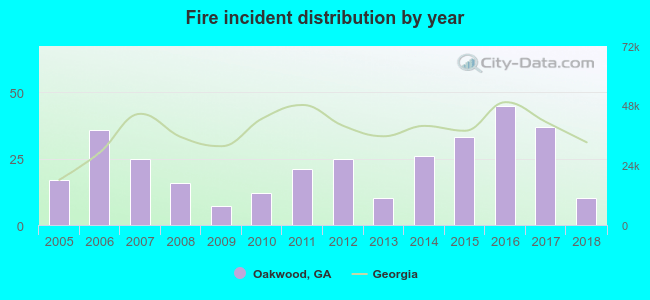 According to the data from the years 2005 - 2018 the average number of fire incidents per year is 23. The highest number of fires - 45 took place in 2016, and the least - 7 in 2009. The data has a dropping trend.
 Based on the data from the years 2005 - 2018 the average number of fire-related casualties per year is 0. The highest number of injuries - 1 took place in 2010, and the lowest - 0 in 2005. The data has a constant trend.
 32.8% incidents where reported in the morning and 67.2% in the evening. The most fires (18.1%) took place on Saturday, and the least (10.9%) on Wednesday.
 Based on the 320 reports from years 2005 - 2018 most fires (12.8%) took place during February, and the least (4.7%) in October.
 Out of all 5,470 cases reported during the years 2005 - 2018, the most belonged to the categories: Rescue & EMS (69.8%), Good Intent Call (11.6%), and Fire (5.9%).
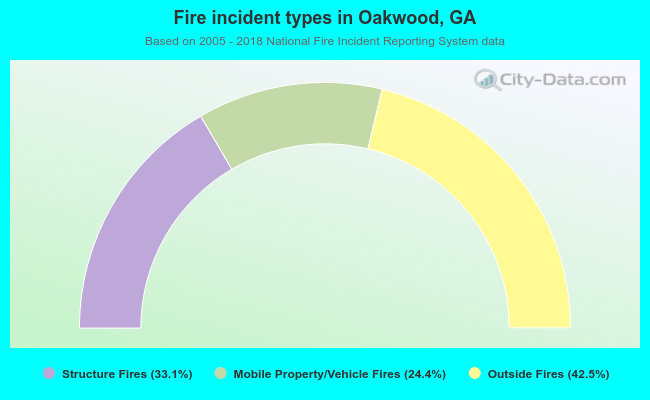 When looking into fire subcategories, the most reports belonged to: Outside Fires (42.5%), and Structure Fires (33.1%).