Oakwood: Fire Incidents, Illinois (IL)
Where are fire incidents reported in Oakwood, IL
Something went wrong! Please refresh the page.
|
| |||||||||||||||||||||||||||||||||||||||||||||||||||||||||||||||||||||||||||||||||||||||||||||||||||||||||||||
2005 - 2018 National Fire Incident Reporting System (NFIRS) incidents
- Incident types reported to NFIRS in Oakwood, IL
- 50342.9%Rescue & EMS
- 31226.6%Fire
- 15413.1%Hazardous Condition
- 1089.2%Good Intent Call
- 675.7%Service Call
- 282.4%False Alarm
- Fire incident types reported to NFIRS in Oakwood, IL
- 14646.8%Outside Fires
- 10734.3%Structure Fires
- 4313.8%Mobile Property/Vehicle Fires
- 165.1%Other
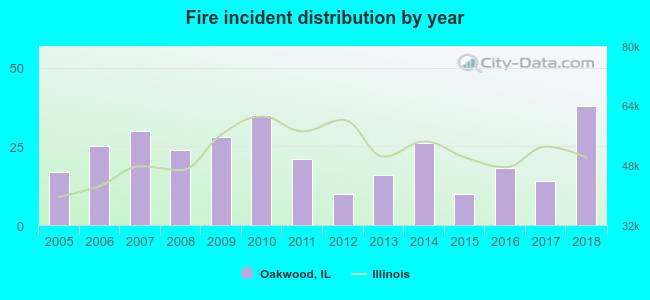 Based on the data from the years 2005 - 2018 the average number of fire incidents per year is 22. The highest number of reported fires - 38 took place in 2018, and the least - 10 in 2012. The data has an increasing trend.
 According to the reports from the years 2005 - 2018 the average number of fire-related yearly casualties is 0. The highest number of casualties - 2 took place in 2005, and the lowest - 0 in 2007. The data has a decreasing trend.
 31.1% incidents where reported in the morning and 68.9% in the evening. The most fires (18.9%) took place on Wednesday, and the least (11.5%) on Monday.
 Based on the 312 fire incidents from years 2005 - 2018 most fires (13.1%) took place during March, and the least (3.5%) in February.
 Out of all 1,172 cases reported during the years 2005 - 2018, the most belonged to the categories: Overpressure Rupture (42.9%), Fire (26.6%), and Rescue & EMS (13.1%).
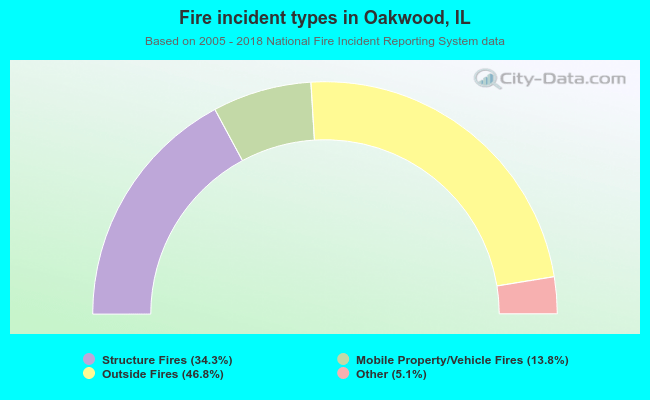 When looking into fire subcategories, the most reports belonged to: Outside Fires (46.8%), and Structure Fires (34.3%).