Ocilla: Fire Incidents, Georgia (GA)
Where are fire incidents reported in Ocilla, GA
Something went wrong! Please refresh the page.
|
| |||||||||||||||||||||||||||||||||||||||||||||||||||||||||||||||||||||||||||||||||||||||||||||||||||||||||||||
2002 - 2018 National Fire Incident Reporting System (NFIRS) incidents
- Incident types reported to NFIRS in Ocilla, GA
- 38566.0%Fire
- 10818.5%Hazardous Condition
- 264.5%False Alarm
- 223.8%Good Intent Call
- 213.6%Service Call
- 193.3%Rescue & EMS
- 10.2%Overpressure Rupture
- 10.2%Severe Weather
- Fire incident types reported to NFIRS in Ocilla, GA
- 15339.7%Structure Fires
- 14236.9%Outside Fires
- 6617.1%Mobile Property/Vehicle Fires
- 246.2%Other
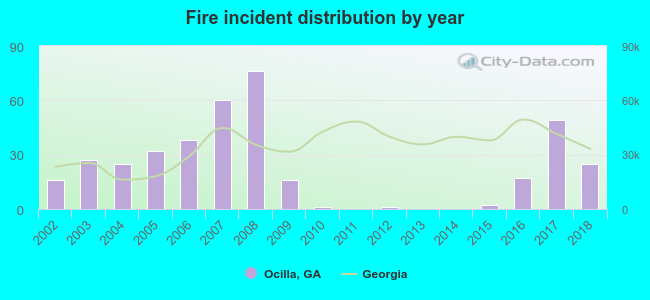 According to the data from the years 2002 - 2018 the average number of fire incidents per year is 23. The highest number of fires - 76 took place in 2008, and the least - 0 in 2011. The data has a growing trend.
 Based on the data from the years 2002 - 2018 the average number of fire-related casualties per year is 0. The highest number of injuries - 1 took place in 2003, and the lowest - 0 in 2002. The data has a constant trend.
 26.5% incidents where reported in the morning and 73.5% in the evening. The most fires (16.1%) took place on Monday, and the least (12.5%) on Sunday.
 Based on the 385 reports from years 2002 - 2018 most fires (12.7%) took place during May, and the least (5.2%) in June.
 Out of all 583 cases reported during the years 2002 - 2018, the most belonged to the categories: Fire (66.0%), Hazardous Condition (18.5%), and False Alarm (4.5%).
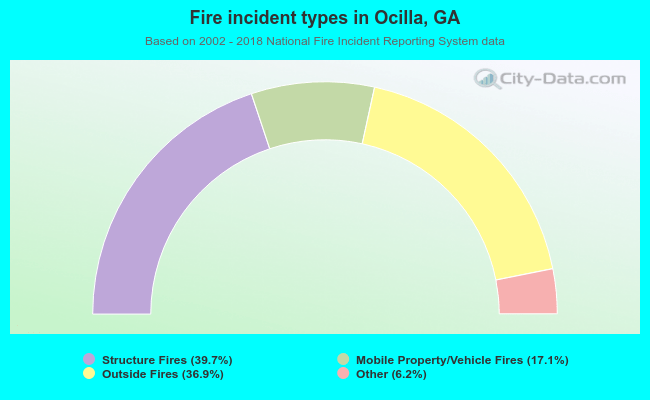 When looking into fire subcategories, the most reports belonged to: Structure Fires (39.7%), and Outside Fires (36.9%).