| Fire incidents reported |
|---|
| Sreet name | Count |
|---|
| CARNAHAN RD | 18 | | BOOTH CREEK RD | 10 | | PARK RD | 8 | | 2ND ST | 6 | | GALILEE RD | 6 | | HIGHWAY 13 | 6 | | SWEDE RD | 6 | | GREENE RD | 4 | | HWY 16 | 4 | | MCINTYRE CREEK RD | 4 | | OTTER CREEK RD | 4 | | SHANNON CREEK RD | 4 | | 105 2ND STREET | 2 | | 12415 CARNAHAN ROAD | 2 | | 14700 K-13 | 2 | | 500 2ND STREET | 2 | | BIGELOW RD | 2 | | BLUE MESA RD | 2 | | CARNAHAN CREEK AND PARK RD | 2 | | CARNAHAN CREEK RD | 2 | | COCHRAN ST | 2 | | DRY CREEK RD | 2 | | FOUR MILE RD | 2 | | GALLIE RD | 2 |
| | | Fire incidents reported |
|---|
| Sreet name | Count |
|---|
| GREEN AND OAK RD | 2 | | GREENE ROAD AND OAK GROVE | 2 | | HIGHWAY 16 | 2 | | HWY 13 | 2 | | K-16 HWY | 2 | | K13 | 2 | | LIVING WATER RANCH RD | 2 | | MARSHAL RD | 2 | | MCLNTYRE | 2 | | OAK GROVE | 2 | | OTOE RD | 2 | | OTTER CREAK RD | 2 | | PAWNEE RD | 2 | | RANDOLPH DR | 2 | | RANDOLPH PARK RD | 2 | | ROUND TREE RD | 2 | | SAGE BRUSH | 2 | | SAGEBRUSH RD | 2 | | SECOND ST | 2 | | SHANUK LN | 2 | | SOUTH OF 15220 CARAHAN ROAD | 2 | | SWEDE RD | 2 | | SWEEDE RD | 2 | | WYANDOT RD | 2 |
|
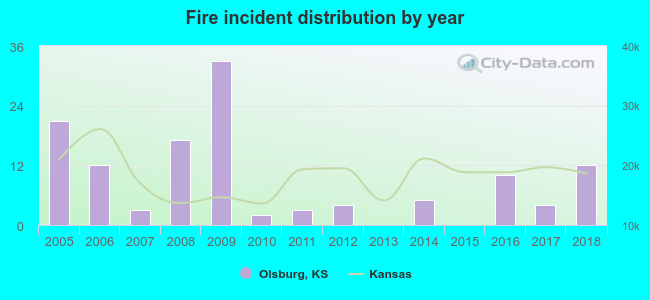 Based on the data from the years 2005 - 2018 the average number of fires per year is 9. The highest number of reported fire incidents - 33 took place in 2009, and the least - 0 in 2013. The data has a declining trend.
 15.9% incidents where reported in the morning and 84.1% in the evening. The most fires (19.0%) took place on Monday, and the least (10.3%) on Friday.
 According to the 126 reports from years 2005 - 2018 most fires (30.2%) took place during April, and the least (0.0%) in September.
 Out of all 154 cases reported during the years 2005 - 2018, the most belonged to the categories: Fire (81.8%), Overpressure Rupture (11.7%), and Hazardous Condition (5.2%).
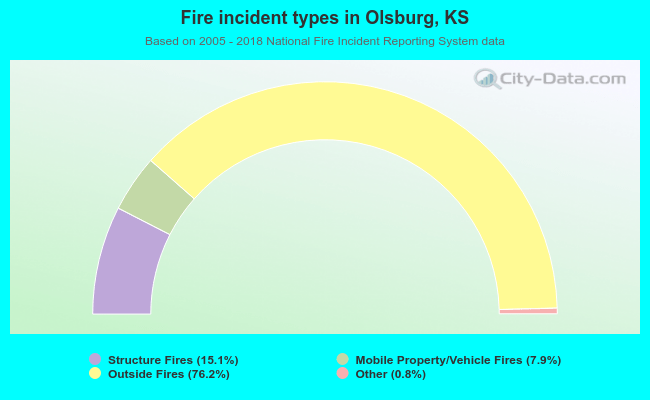 When looking into fire subcategories, the most incidents belonged to: Outside Fires (76.2%), and Structure Fires (15.1%).