Olympia Fields: Fire Incidents, Illinois (IL)
Where are fire incidents reported in Olympia Fields, IL
Something went wrong! Please refresh the page.
|
| |||||||||||||||||||||||||||||||||||||||||||||||||||||||||||||||||||||||||||||||||||||||||||||||||||||||||||||
2002 - 2018 National Fire Incident Reporting System (NFIRS) incidents
- Incident types reported to NFIRS in Olympia Fields, IL
- 1,53744.3%Rescue & EMS
- 95327.5%False Alarm
- 3299.5%Hazardous Condition
- 2537.3%Fire
- 2076.0%Good Intent Call
- 1835.3%Service Call
- 60.2%Special Incident
- Fire incident types reported to NFIRS in Olympia Fields, IL
- 15260.1%Structure Fires
- 5220.6%Outside Fires
- 4317.0%Mobile Property/Vehicle Fires
- 62.4%Other
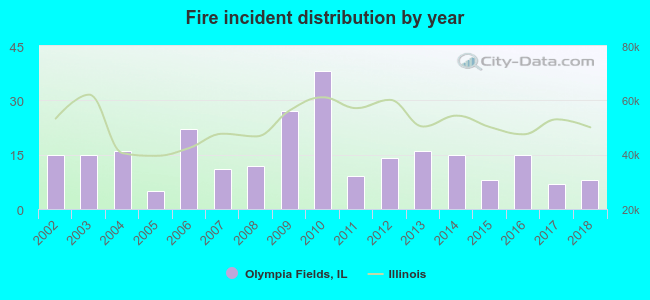 According to the data from the years 2002 - 2018 the average number of fire incidents per year is 15. The highest number of fire incidents - 38 took place in 2010, and the least - 5 in 2005. The data has a declining trend.
The average number of yearly fire incidents per 10k residents in Olympia Fields, IL compared to nearest cities:
(Note: Based on data for the last 3 years, including only cities with population 5,000 and above)
| Olympia Fields: | 19.8 |
| Flossmoor: | 55.0 |
| Park Forest: | 45.2 |
| Matteson: | 55.2 |
| Chicago Heights: | 29.5 |
| Richton Park: | 46.3 |
| Homewood: | 44.9 |
| Country Club Hills: | 63.0 |
| Hazel Crest: | 57.3 |

 Based on the data from the years 2002 - 2018 the average number of fire-related casualties per year is 0. The highest number of injuries - 2 took place in 2002, and the lowest - 0 in 2003. The data has a declining trend.
 32.8% incidents where reported in the morning and 67.2% in the evening. The most fires (24.9%) took place on Monday, and the least (9.9%) on Tuesday.
 According to the 253 incident reports from years 2002 - 2018 most fires (14.6%) took place during February, and the least (5.1%) in October.
 Out of all 3,471 cases reported during the years 2002 - 2018, the most belonged to the categories: Rescue & EMS (44.3%), False Alarm (27.5%), and Hazardous Condition (9.5%).
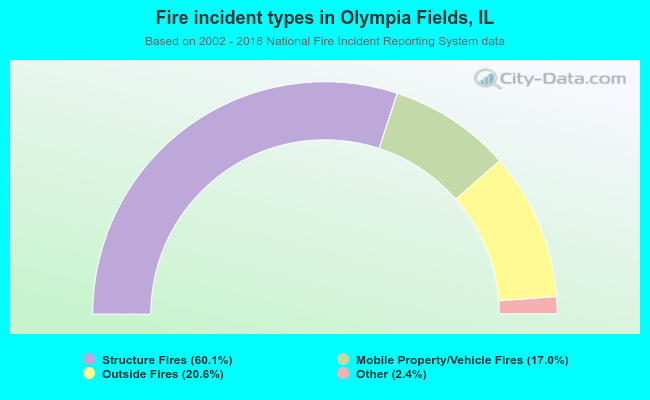 When looking into fire subcategories, the most reports belonged to: Structure Fires (60.1%), and Outside Fires (20.6%).