| Fire incidents reported |
|---|
| Sreet name | Count |
|---|
| M33 HWY | 24 | | TWIN SCHOOLS HWY | 14 | | ALLIS HWY | 10 | | BLACK RIVER RD | 10 | | COLD CREEK RD | 10 | | 3 MILE HWY | 8 | | 5 MILE HWY | 8 | | 638 HWY | 8 | | HACKETT LAKE HWY | 8 | | M211 HWY | 8 | | M68 HWY | 8 | | SHAW ST | 8 | | ELM ST | 6 | | M-211 | 6 | | POPULAR ST | 6 | | PORTER RD | 6 | | SIX MILE HWY | 6 | | STATE ST | 6 | | STEWART BEACH HWY | 6 | | 1 MILE HWY | 4 | | 3RD ST | 4 | | CALDWELL RD | 4 | | COLLEGE ST | 4 | | COUNTY LINE RD | 4 | | FAIRVIEW ST | 4 |
| | | Fire incidents reported |
|---|
| Sreet name | Count |
|---|
| LITTLE RAINEY RD | 4 | | M-33 HWY | 4 | | MICHIGAN AVE | 4 | | MILLIGAN HWY | 4 | | NORTH PORTER RD | 4 | | ONE MILE HWY | 4 | | SO. PORTER RD | 4 | | STOCK HWY | 4 | | STONEY CREEK HWY | 4 | | THOMPSON RD | 4 | | WASHINGTON AVE | 4 | | 1000 M68 | 2 | | 1036 MICHIGAN AVE. ST | 2 | | 1048 M-68/33 HWY. ST | 2 | | 1170 S. 211 HWY. ST | 2 | | 11901 WAVELAND AVE. | 2 | | 13927 JACKPINE TRAIL ST | 2 | | 18477 5 MILE HWY | 2 | | 19340 M-68 HWY. ST | 2 | | 19341 N. ALLIS HWY. ST | 2 | | 19781 WHITE PINE HWY. ST | 2 | | 1ST ST | 2 | | 20346 SHAW ST. ST | 2 | | 20417 STATE ST. ST | 2 | | 20483 SHAW ST ST | 2 |
|
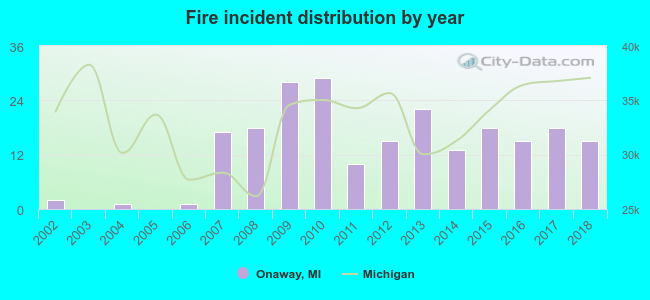 According to the data from the years 2002 - 2018 the average number of fire incidents per year is 13. The highest number of reported fires - 29 took place in 2010, and the least - 0 in 2003. The data has a rising trend.
 35.6% incidents where reported in the morning and 64.4% in the evening. The most fires (18.9%) took place on Saturday, and the least (10.4%) on Thursday.
 According to the 222 fire incident reports from years 2002 - 2018 most fires (13.5%) took place during March, and the least (4.5%) in May.
 Out of all 334 cases reported during the years 2002 - 2018, the most belonged to the categories: Fire (66.5%), Hazardous Condition (18.3%), and Rescue & EMS (6.9%).
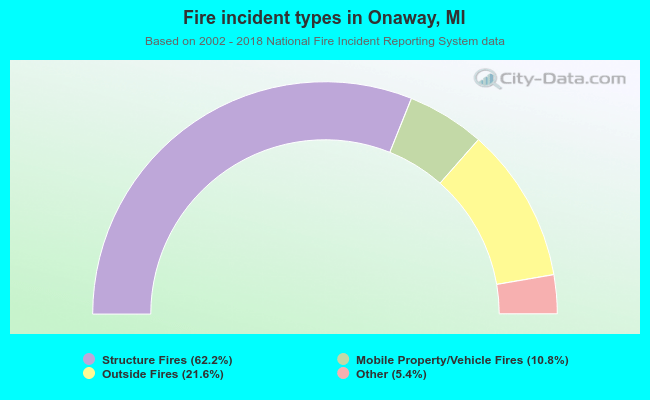 When looking into fire subcategories, the most incidents belonged to: Structure Fires (62.2%), and Outside Fires (21.6%).