| Fire incidents reported |
|---|
| Sreet name | Count |
|---|
| 183RD ST | 6 | | 182ND ST | 4 | | 18569 309TH AVE | 4 | | 187TH ST | 4 | | 30170 191ST STREET | 4 | | 1005 PONDEROSA DR | 2 | | 102 SOUTH 10TH STREET | 2 | | 17364 318 AVE. | 2 | | 178 ST AND 286 AVE. | 2 | | 18072 311TH AVE | 2 | | 180TH ST | 2 | | 182 ST | 2 | | 182ND STREET 293AVE | 2 | | 182ST STREET | 2 | | 18329 301 AVE | 2 | | 18381 282 AVE | 2 | | 183RD STREET | 2 | | 18437 CAPRI PLACE | 2 | | 18441 278TH AVE | 2 | | 18473 319TH AVE | 2 | | 184TH ST | 2 | | 18514 295TH AVE | 2 | | 18569 309TH AVE | 2 | | 185TH ST | 2 | | 185TH ST AND 284TH AVE | 2 |
| | | Fire incidents reported |
|---|
| Sreet name | Count |
|---|
| 18607 303 AVE | 2 | | 18656 187TH STREET | 2 | | 186TH ST | 2 | | 18756 280TH AVENUE | 2 | | 188TH ST | 2 | | 19056 310 AVE | 2 | | 190TH STREET | 2 | | 191 ST | 2 | | 19100 324 AVE | 2 | | 191ST ST | 2 | | 191ST STREET | 2 | | 191ST STREET 303RD AVE | 2 | | 194TH ST | 2 | | 194TH STREET AND 300TH AV | 2 | | 19505 US HIGHWAY 83 | 2 | | 279TH AVE | 2 | | 291 AVE | 2 | | 295 AVE | 2 | | 295TH AVE | 2 | | 300 ASH AVE | 2 | | 300TH AVE | 2 | | 302 AVENUE | 2 | | 302 S 10TH ST | 2 | | 30356 193RD STREET | 2 | | |
|
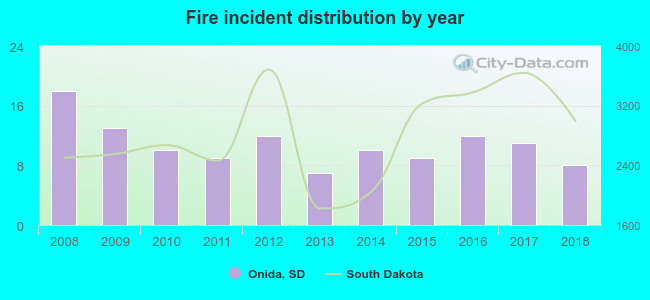 Based on the data from the years 2008 - 2018 the average number of fires per year is 11. The highest number of reported fire incidents - 18 took place in 2008, and the least - 7 in 2013. The data has a dropping trend.
 18.5% incidents where reported in the morning and 81.5% in the evening. The most fires (21.0%) took place on Wednesday, and the least (4.2%) on Thursday.
 Based on the 119 fires from years 2008 - 2018 most fires (20.2%) took place during July, and the least (2.5%) in January.
 Out of all 128 cases reported during the years 2008 - 2018, the most belonged to the categories: Fire (93.0%), Rescue & EMS (4.7%), and Overpressure Rupture (0.8%).
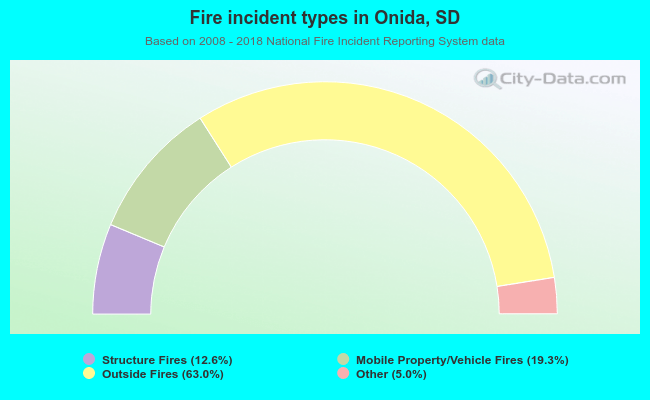 When looking into fire subcategories, the most incidents belonged to: Outside Fires (63.0%), and Mobile Property/Vehicle Fires (19.3%).