Ottawa: Fire Incidents, Ohio (OH)
Where are fire incidents reported in Ottawa, OH
Something went wrong! Please refresh the page.
|
| |||||||||||||||||||||||||||||||||||||||||||||||||||||||||||||||||||||||||||||||||||||||||||||||||||||||||||||
| Other | 16 | |||||||||||||||||||||||||||||||||||||||||||||||||||||||||||||||||||||||||||||||||||||||||||||||||||||||||||||
2002 - 2018 National Fire Incident Reporting System (NFIRS) incidents
- Incident types reported to NFIRS in Ottawa, OH
- 58834.0%Fire
- 44625.8%Hazardous Condition
- 38622.3%Rescue & EMS
- 1317.6%Good Intent Call
- 975.6%Service Call
- 412.4%False Alarm
- 211.2%Special Incident
- 120.7%Overpressure Rupture
- 90.5%Severe Weather
- Fire incident types reported to NFIRS in Ottawa, OH
- 30952.6%Structure Fires
- 19733.5%Outside Fires
- 6010.2%Mobile Property/Vehicle Fires
- 223.7%Other
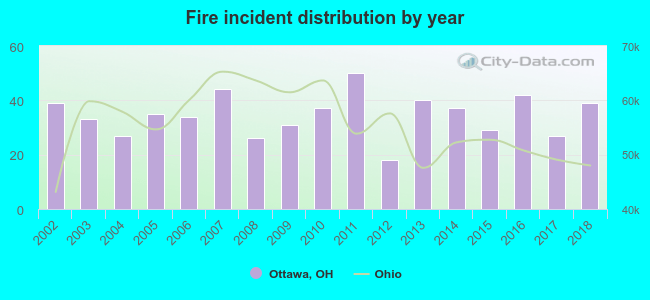 Based on the data from the years 2002 - 2018 the average number of fire incidents per year is 35. The highest number of reported fires - 50 took place in 2011, and the least - 18 in 2012. The data has a constant trend.
 The median response time based on all reported fire incidents is 7 minutes. This is about the same as the Ohio median value.
The median response time in Ottawa, OH compared to nearest cities:
(Note: Based on data for all years, including only cities with at least 500 fire incidents)
| Ottawa: | 7 minutes |
| Elida: | 6 minutes |
| Lima: | 4 minutes |
| Delphos: | 5 minutes |
| Findlay: | 6 minutes |
| Harrod: | 8 minutes |
| Defiance: | 8 minutes |
| Napoleon: | 7 minutes |
| Paulding: | 12 minutes |
 29.9% incidents where reported in the morning and 70.1% in the evening. The most fires (16.8%) took place on Monday, and the least (11.9%) on Wednesday.
 According to the 588 fire incidents from years 2002 - 2018 most fires (12.2%) took place during July, and the least (5.1%) in May.
 Out of all 1,731 cases reported during the years 2002 - 2018, the most belonged to the categories: Fire (34.0%), Hazardous Condition (25.8%), and Rescue & EMS (22.3%).
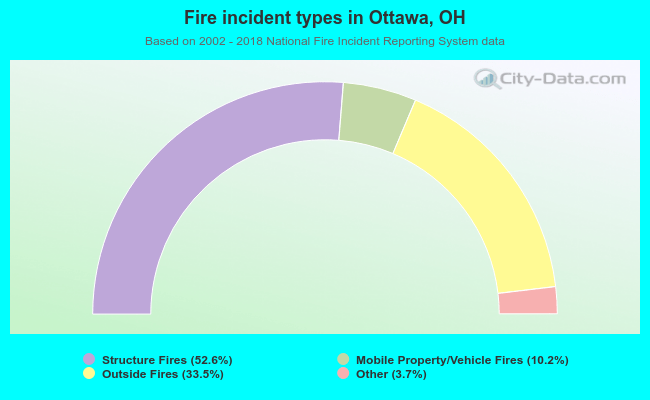 When looking into fire subcategories, the most incidents belonged to: Structure Fires (52.6%), and Outside Fires (33.5%).