Paola: Fire Incidents, Kansas (KS)
Where are fire incidents reported in Paola, KS
Something went wrong! Please refresh the page.
| Fire incidents reported | |
|---|---|
| Sreet name | Count |
| 287TH ST | 152 |
| HOSPITAL DR | 82 |
| 319TH ST | 78 |
| 327TH ST | 78 |
| K-68 HWY | 78 |
| 303RD ST | 72 |
| LOOKOUT RD | 66 |
| 311TH ST | 62 |
| OLD KANSAS CITY RD | 58 |
| SOMERSET RD | 52 |
| PEORIA ST | 48 |
| 295TH ST | 46 |
| PEARL ST | 46 |
| 271ST ST | 44 |
| LONE STAR RD | 42 |
| PLUM CREEK RD | 42 |
| OAK GROVE RD | 36 |
| OSAWATOMIE RD | 36 |
| PIANKISHAW ST | 34 |
| SILVER ST | 34 |
| 335TH ST | 32 |
| K68 HWY | 32 |
| US 169 HWY | 32 |
| WEA ST | 30 |
| 343RD ST | 28 |
| CRESCENT HILL RD | 28 |
| CEDAR NILES RD | 26 |
| HEDGE LANE | 26 |
| CHIPPEWA ST | 24 |
| BAPTISTE DR | 22 |
| Other | 16 |
2002 - 2018 National Fire Incident Reporting System (NFIRS) incidents
- Incident types reported to NFIRS in Paola, KS
- 1,48242.2%Fire
- 62317.7%Good Intent Call
- 45813.0%Hazardous Condition
- 39511.2%Rescue & EMS
- 2928.3%Service Call
- 1614.6%False Alarm
- 952.7%Special Incident
- 40.1%Overpressure Rupture
- Fire incident types reported to NFIRS in Paola, KS
- 82855.9%Outside Fires
- 45931.0%Structure Fires
- 17912.1%Mobile Property/Vehicle Fires
- 161.1%Other
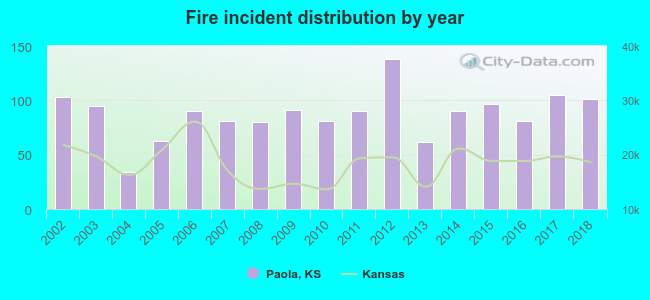 According to the data from the years 2002 - 2018 the average number of fire incidents per year is 87. The highest number of reported fire incidents - 138 took place in 2012, and the least - 34 in 2004. The data has a dropping trend.
The average number of yearly fire incidents per 10k residents in Paola, KS compared to nearest cities:
(Note: Based on data for the last 3 years, including only cities with population 5,000 and above)
| Paola: | 171.0 |
| Spring Hill: | 96.7 |
| Gardner: | 33.9 |
| Ottawa: | 106.2 |
| Olathe: | 21.1 |
| Overland Park: | 21.0 |
| De Soto: | 36.4 |
| Leawood: | 17.8 |
| Lenexa: | 30.4 |
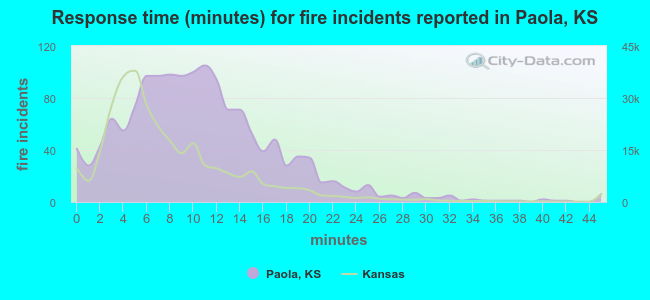 The median response time based on all reported fire incidents is 10 minutes. This is higher compared to the Kansas median value.
The median response time in Paola, KS compared to nearest cities:
(Note: Based on data for all years, including only cities with at least 500 fire incidents)
| Paola: | 10 minutes |
| Osawatomie: | 9 minutes |
| Louisburg: | 8 minutes |
| Spring Hill: | 7 minutes |
| Wellsville: | 10 minutes |
| Gardner: | 6 minutes |
| Ottawa: | 5 minutes |
| Olathe: | 5 minutes |
| Baldwin City: | 9 minutes |
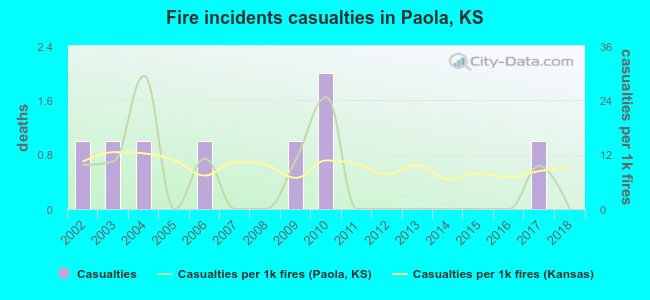 According to the reports from the years 2002 - 2018 the average number of fire-related yearly casualties is 0. The highest number of reported casualties - 2 took place in 2010, and the lowest - 0 in 2005. The data has a declining trend.
The average number of injuries per 1,000 fires is 6. This indicator was the highest - 29 in 2004, and the lowest 0 in 2005. The trend for casualties per 1,000 fires is dropping. Compared to the Kansas value the number of casualties per 1,000 fire incidents is lower.
According to the reports from the years 2002 - 2018 the average number of fire-related yearly casualties is 0. The highest number of reported casualties - 2 took place in 2010, and the lowest - 0 in 2005. The data has a declining trend.
The average number of injuries per 1,000 fires is 6. This indicator was the highest - 29 in 2004, and the lowest 0 in 2005. The trend for casualties per 1,000 fires is dropping. Compared to the Kansas value the number of casualties per 1,000 fire incidents is lower.Casualties per 1,000 incidents in Paola, KS compared to nearest cities:
(Note: Based on data for all years, including only cities with at least 500 fire incidents)
| Paola: | 5.4 |
| Osawatomie: | 2.1 |
| Louisburg: | 1.3 |
| Spring Hill: | 14.0 |
| Wellsville: | 1.3 |
| Gardner: | 6.3 |
| Ottawa: | 17.8 |
| Olathe: | 17.6 |
| Baldwin City: | 5.7 |
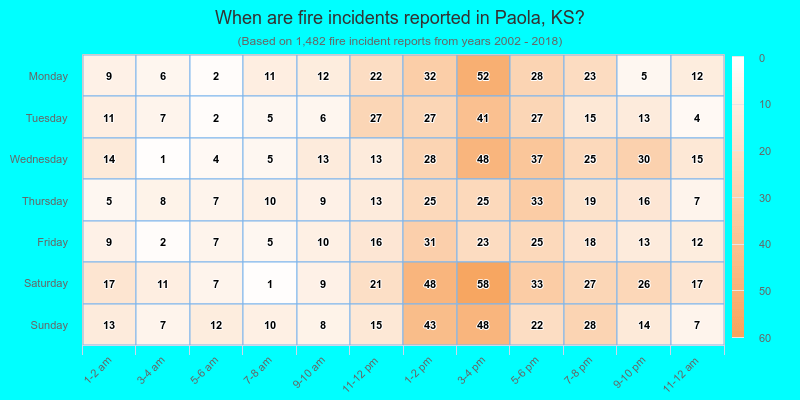
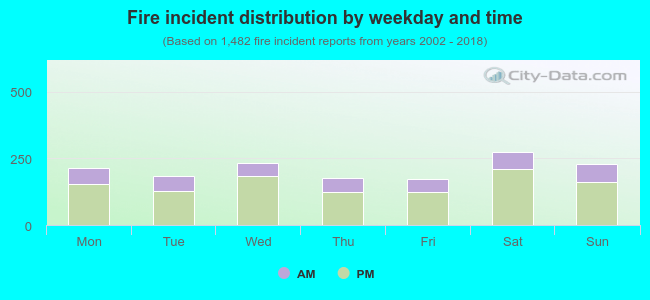 27.1% incidents where reported in the morning and 72.9% in the evening. The most fires (18.6%) took place on Saturday, and the least (11.5%) on Friday.
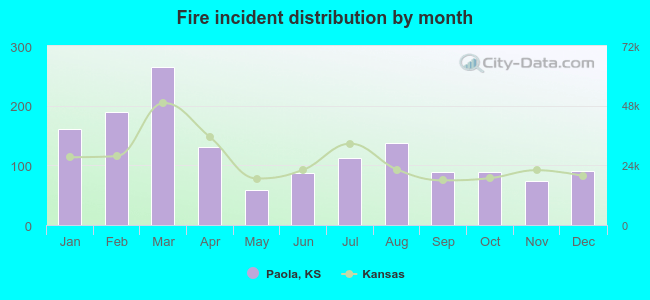 According to the 1,482 fire incidents from years 2002 - 2018 most fires (17.8%) took place during March, and the least (3.9%) in May.
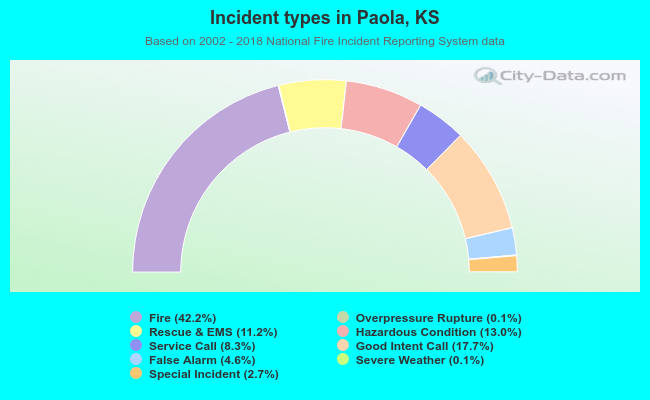 Out of all 3,513 cases reported during the years 2002 - 2018, the most belonged to the categories: Fire (42.2%), Good Intent Call (17.7%), and Hazardous Condition (13.0%).
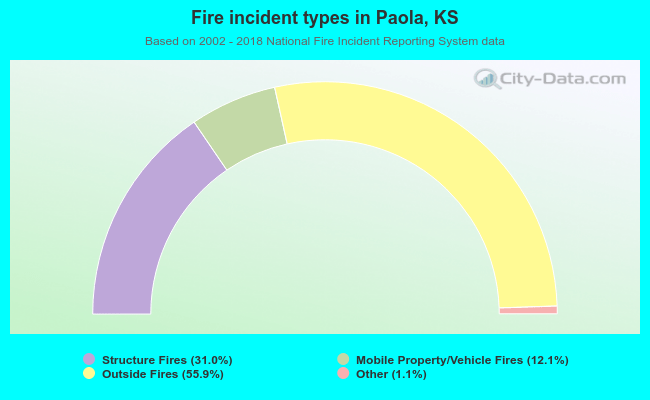 When looking into fire subcategories, the most incidents belonged to: Outside Fires (55.9%), and Structure Fires (31.0%).