Paramount: Fire Incidents, California (CA)
Where are fire incidents reported in Paramount, CA
Something went wrong! Please refresh the page.
|
| |||||||||||||||||||||||||||||||||||||||||||||||||||||||||||||||||||||||||||||||||||||||||||||||||||||||||||||
2005 - 2018 National Fire Incident Reporting System (NFIRS) incidents
- Incident types reported to NFIRS in Paramount, CA
- 10,92461.1%Rescue & EMS
- 3,99822.4%Good Intent Call
- 1,1096.2%False Alarm
- 1,0726.0%Fire
- 4472.5%Hazardous Condition
- 3031.7%Service Call
- Fire incident types reported to NFIRS in Paramount, CA
- 48645.3%Outside Fires
- 28126.2%Mobile Property/Vehicle Fires
- 24322.7%Structure Fires
- 625.8%Other
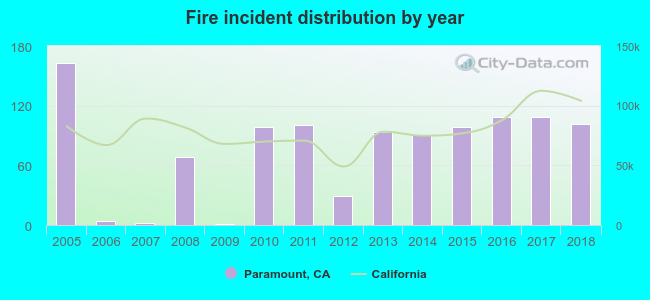 Based on the data from the years 2005 - 2018 the average number of fires per year is 77. The highest number of fire incidents - 163 took place in 2005, and the least - 1 in 2009. The data has a declining trend.
The average number of yearly fire incidents per 10k residents in Paramount, CA compared to nearest cities:
(Note: Based on data for the last 3 years, including only cities with population 5,000 and above)
| Paramount: | 19.3 |
| Bellflower: | 19.1 |
| Lynwood: | 19.4 |
| Downey: | 13.6 |
| Compton: | 28.2 |
| South Gate: | 15.8 |
| Lakewood: | 12.0 |
| Cudahy: | 13.6 |
| Bell Gardens: | 18.3 |
 The median response time based on all reported fire incidents is 5 minutes. This is lower compared to the California median value.
The median response time in Paramount, CA compared to nearest cities:
(Note: Based on data for all years, including only cities with at least 500 fire incidents)
| Paramount: | 5 minutes |
| Bellflower: | 4 minutes |
| Lynwood: | 4 minutes |
| Downey: | 7 minutes |
| Compton: | 6 minutes |
| South Gate: | 5 minutes |
| Lakewood: | 4 minutes |
| Bell Gardens: | 5 minutes |
| Norwalk: | 5 minutes |
 35.3% incidents where reported in the morning and 64.7% in the evening. The most fires (16.4%) took place on Sunday, and the least (10.4%) on Wednesday.
 According to the 1,072 incident reports from years 2005 - 2018 most fires (11.9%) took place during January, and the least (5.9%) in December.
 Out of all 17,881 cases reported during the years 2005 - 2018, the most belonged to the categories: Rescue & EMS (61.1%), Good Intent Call (22.4%), and False Alarm (6.2%).
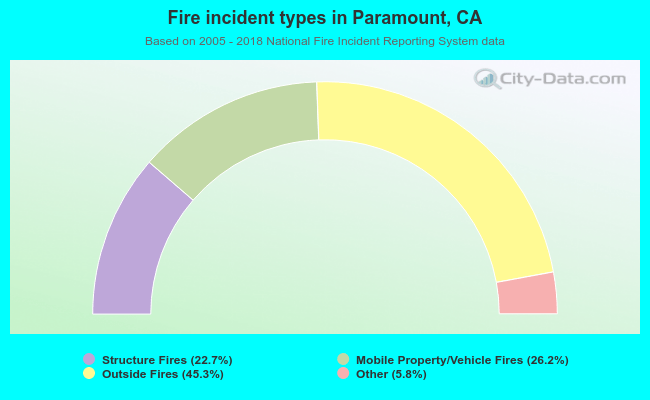 When looking into fire subcategories, the most reports belonged to: Outside Fires (45.3%), and Mobile Property/Vehicle Fires (26.2%).