| Fire incidents reported |
|---|
| Sreet name | Count |
|---|
| HIGHWAY 97 HWY | 48 | | HIGHWAY 153 HWY | 44 | | STARR ROAD RD | 18 | | ALTA LAKE ROAD RD | 10 | | BEACH ST | 6 | | HWY 153 HWY | 6 | | US 97 | 6 | | BILL SHAW ROAD HLS | 4 | | BILL SHAW ROAD RD | 4 | | HIGHWAY 153 | 4 | | INDUSTRIAL WAY RD | 4 | | INDUSTRIAL WAY ST | 4 | | IVES ST | 4 | | PETERSON ROAD | 4 | | WARREN RD | 4 | | WATSON DRAW ROAD | 4 | | WATSON DRAW ROAD RD | 4 | | 490 CRANE RD | 2 | | ALTA LAKE AREA RD | 2 | | ALTA LAKE STATE PARK RD | 2 | | ALTA LAKEAZWELL RD | 2 | | ANTOINE CREEK RD | 2 | | BEACH STREET ST | 2 | | BILL SHAW RD HLS | 2 | | CEMETARY ROAD RD | 2 |
| | | Fire incidents reported |
|---|
| Sreet name | Count |
|---|
| CHELAN AIRPORT | 2 | | CITY PATEROSINDIAN DANBREW | 2 | | DOWN TOWN PATEROS | 2 | | EVELINE RD | 2 | | FISH HATCHERY RD ORCH | 2 | | GOLF COURSE DRIVE | 2 | | GOLF COURSE DRIVE ST | 2 | | GOLF COURSE ROAD | 2 | | GOLF PLACE DRIVE RD | 2 | | HIGHWAY 153 HWY | 2 | | HIGHWAY 153 HLS | 2 | | HIGHWAY 97 | 2 | | HIGHWAY 97 ANX | 2 | | HIGHWAY 97/HIGHWAY 153 DR | 2 | | HWY 97 PATEROS | 2 | | INDEPENDENCE | 2 | | IVES STREET RD | 2 | | MANSFIELD | 2 | | MCALVEY DRIVE ST | 2 | | NORTH STREET ST | 2 | | OTTO DRIVE | 2 | | OTTO ROAD RD | 2 | | PATEROS | 2 | | PATEROS MALL | 2 | | |
|
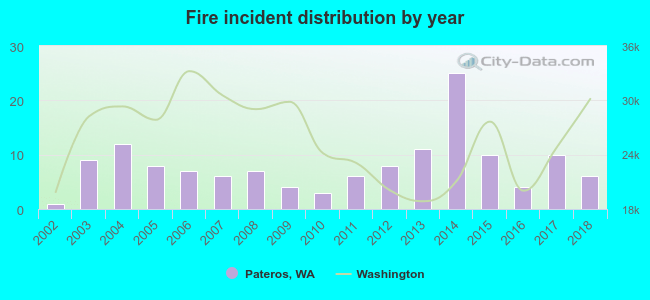 Based on the data from the years 2002 - 2018 the average number of fire incidents per year is 8. The highest number of reported fires - 25 took place in 2014, and the least - 1 in 2002. The data has a growing trend.
 26.3% incidents where reported in the morning and 73.7% in the evening. The most fires (24.8%) took place on Thursday, and the least (9.5%) on Tuesday.
 Based on the 137 incident reports from years 2002 - 2018 most fires (25.5%) took place during July, and the least (2.2%) in November.
 Out of all 277 cases reported during the years 2002 - 2018, the most belonged to the categories: Fire (49.5%), Overpressure Rupture (26.0%), and Service Call (11.6%).
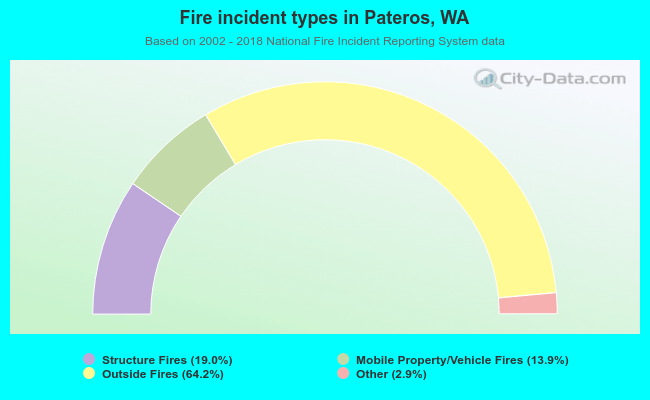 When looking into fire subcategories, the most incidents belonged to: Outside Fires (64.2%), and Structure Fires (19.0%).