Pelican Rapids: Fire Incidents, Minnesota (MN)
Where are fire incidents reported in Pelican Rapids, MN
Something went wrong! Please refresh the page.
|
| |||||||||||||||||||||||||||||||||||||||||||||||||||||||||||||||||||||||||||||||||||||||||||||||||||||||||||||
| Other | 56 | |||||||||||||||||||||||||||||||||||||||||||||||||||||||||||||||||||||||||||||||||||||||||||||||||||||||||||||
2002 - 2018 National Fire Incident Reporting System (NFIRS) incidents
- Incident types reported to NFIRS in Pelican Rapids, MN
- 36870.2%Fire
- 407.6%Hazardous Condition
- 356.7%Rescue & EMS
- 326.1%False Alarm
- 295.5%Service Call
- 163.1%Good Intent Call
- 20.4%Overpressure Rupture
- 20.4%Severe Weather
- Fire incident types reported to NFIRS in Pelican Rapids, MN
- 16945.9%Structure Fires
- 14138.3%Outside Fires
- 4712.8%Mobile Property/Vehicle Fires
- 113.0%Other
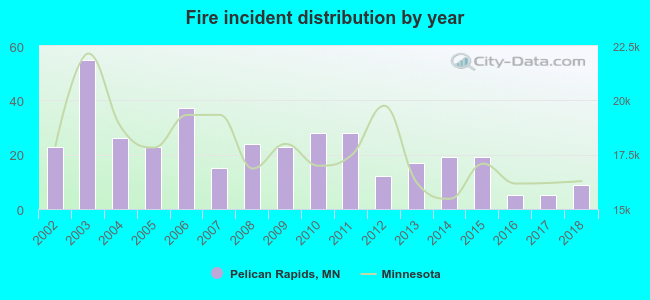 According to the data from the years 2002 - 2018 the average number of fires per year is 22. The highest number of reported fires - 55 took place in 2003, and the least - 5 in 2016. The data has a decreasing trend.
 27.7% incidents where reported in the morning and 72.3% in the evening. The most fires (18.2%) took place on Saturday, and the least (11.1%) on Wednesday.
 According to the 368 reports from years 2002 - 2018 most fires (16.3%) took place during April, and the least (3.5%) in December.
 Out of all 524 cases reported during the years 2002 - 2018, the most belonged to the categories: Fire (70.2%), Hazardous Condition (7.6%), and Rescue & EMS (6.7%).
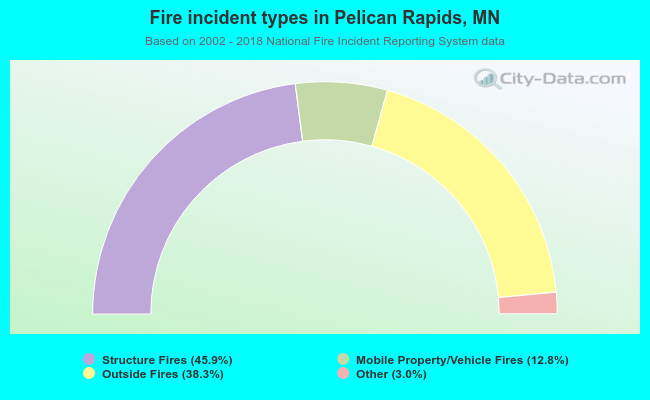 When looking into fire subcategories, the most incidents belonged to: Structure Fires (45.9%), and Outside Fires (38.3%).