| Fire incidents reported |
|---|
| Sreet name | Count |
|---|
| CASCADE RD | 22 | | ROUTE 20 HWY | 14 | | SUNDOWN RD | 12 | | COTTINGHAM RD | 10 | | HUMKE RD | 10 | | MONASTERY RD | 10 | | MELLERAY CIR | 8 | | OLD HIGHWAY RD | 8 | | PILOT GROVE RD | 8 | | CYPRESS DR | 6 | | DUTCH LANE RD | 6 | | KEY CITY LN | 6 | | NEW MELLERAY RD | 6 | | SWISS VALLEY RD | 6 | | BRADY ST | 4 | | CHUCKS CT | 4 | | COUNTRY CLUB DR | 4 | | COX SPRINGS RD | 4 | | GRAF RD | 4 | | OLD HIWAY RD RD | 4 | | 7111 RYAN RD. | 2 | | BAKEY LANE | 2 | | BARRINGTON DRIVE ST | 2 | | BLUESTEM WAY | 2 | | BMR LN | 2 |
| | | Fire incidents reported |
|---|
| Sreet name | Count |
|---|
| BRYN DR | 2 | | BUDD ROAD RD | 2 | | CARDINAL DR | 2 | | CASHEL EAST DR | 2 | | CEDAR RIDGE CT | 2 | | CLEAR VIEW HGTS. RD. | 2 | | CLEARVIEW HIEGHTS RD | 2 | | DEPOT RDG | 2 | | FRONTIER CT | 2 | | GRAF ROAD RD | 2 | | HENDRICKS LN RD | 2 | | HIGHWAY 20 | 2 | | HIGHWAY 52 HWY | 2 | | HIGLEY RD | 2 | | HUMKE RD | 2 | | HUMKEE RD | 2 | | JERICHO RD | 2 | | KAPP DR | 2 | | MAJESTIC DR | 2 | | MIDDLE RD | 2 | | NOONAN ST | 2 | | NORTH CASCADE RD RD | 2 | | PEOSTA ST ST | 2 | | PETERSON DR | 2 | | |
|
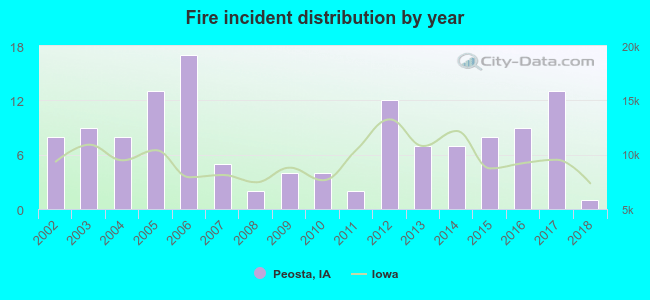 According to the data from the years 2002 - 2018 the average number of fires per year is 8. The highest number of reported fire incidents - 17 took place in 2006, and the least - 1 in 2018. The data has a decreasing trend.
 30.2% incidents where reported in the morning and 69.8% in the evening. The most fires (18.6%) took place on Sunday, and the least (10.1%) on Wednesday.
 According to the 129 incident reports from years 2002 - 2018 most fires (18.6%) took place during April, and the least (2.3%) in June.
 Out of all 631 cases reported during the years 2002 - 2018, the most belonged to the categories: Rescue & EMS (59.9%), Fire (20.4%), and Hazardous Condition (9.5%).
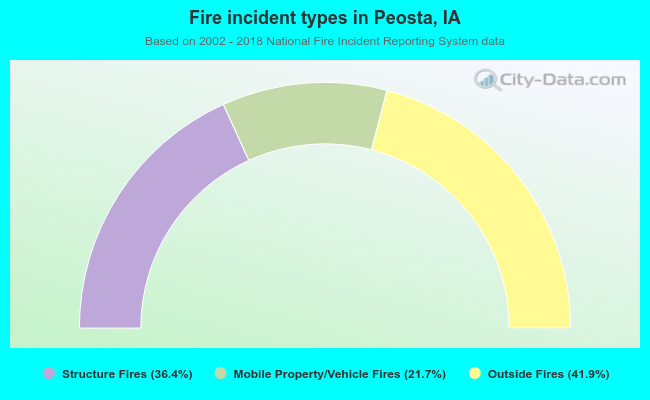 When looking into fire subcategories, the most reports belonged to: Outside Fires (41.9%), and Structure Fires (36.4%).