Perkins: Fire Incidents, Oklahoma (OK)
Where are fire incidents reported in Perkins, OK
Something went wrong! Please refresh the page.
|
| |||||||||||||||||||||||||||||||||||||||||||||||||||||||||||||||||||||||||||||||||||||||||||||||||||||||||||||
2003 - 2018 National Fire Incident Reporting System (NFIRS) incidents
- Incident types reported to NFIRS in Perkins, OK
- 1,44053.9%Rescue & EMS
- 73127.3%Fire
- 1977.4%Good Intent Call
- 1154.3%Service Call
- 1104.1%Hazardous Condition
- 642.4%False Alarm
- 140.5%Special Incident
- Fire incident types reported to NFIRS in Perkins, OK
- 55676.1%Outside Fires
- 10314.1%Structure Fires
- 658.9%Mobile Property/Vehicle Fires
- 71.0%Other
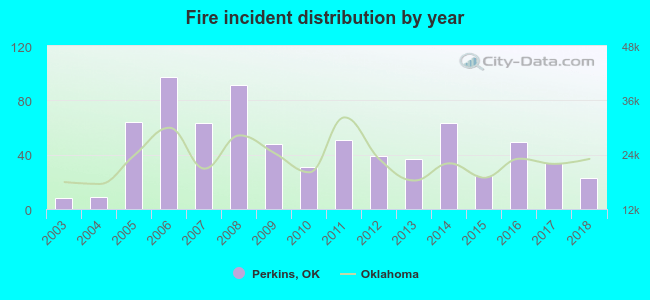 Based on the data from the years 2003 - 2018 the average number of fire incidents per year is 46. The highest number of fires - 97 took place in 2006, and the least - 8 in 2003. The data has a growing trend.
 The median response time based on all reported fire incidents is 6 minutes. This is about the same as the state median value.
The median response time in Perkins, OK compared to nearest cities:
(Note: Based on data for all years, including only cities with at least 500 fire incidents)
| Perkins: | 6 minutes |
| Stillwater: | 8 minutes |
| Cushing: | 7 minutes |
| Wellston: | 10 minutes |
| Chandler: | 9 minutes |
| Luther: | 10 minutes |
| Guthrie: | 8 minutes |
| Drumright: | 7 minutes |
| Stroud: | 10 minutes |
 23.4% incidents where reported in the morning and 76.6% in the evening. The most fires (14.9%) took place on Saturday, and the least (13.0%) on Monday.
 Based on the 731 fires from years 2003 - 2018 most fires (17.1%) took place during March, and the least (4.8%) in October.
 Out of all 2,673 cases reported during the years 2003 - 2018, the most belonged to the categories: Rescue & EMS (53.9%), Fire (27.3%), and Good Intent Call (7.4%).
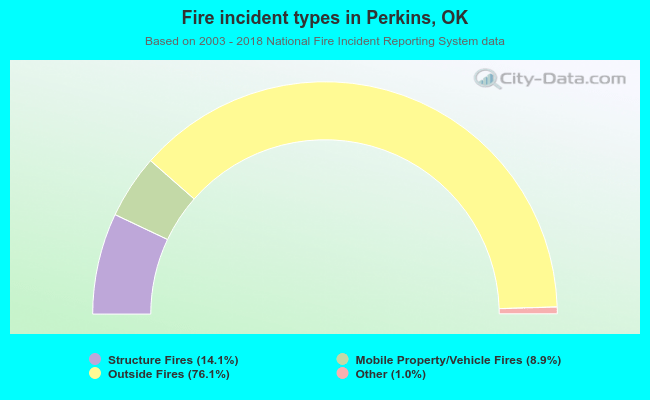 When looking into fire subcategories, the most incidents belonged to: Outside Fires (76.1%), and Structure Fires (14.1%).