Perryville: Fire Incidents, Arkansas (AR)
Where are fire incidents reported in Perryville, AR
Something went wrong! Please refresh the page.
|
| |||||||||||||||||||||||||||||||||||||||||||||||||||||||||||||||||||||||||||||||||||||||||||||||||||||||||||||
| Other | 114 | |||||||||||||||||||||||||||||||||||||||||||||||||||||||||||||||||||||||||||||||||||||||||||||||||||||||||||||
2005 - 2018 National Fire Incident Reporting System (NFIRS) incidents
- Incident types reported to NFIRS in Perryville, AR
- 52463.4%Fire
- 19023.0%Rescue & EMS
- 566.8%Hazardous Condition
- 273.3%Good Intent Call
- 161.9%Service Call
- 70.8%False Alarm
- 50.6%Severe Weather
- 10.1%Special Incident
- Fire incident types reported to NFIRS in Perryville, AR
- 24246.2%Outside Fires
- 21841.6%Structure Fires
- 407.6%Mobile Property/Vehicle Fires
- 244.6%Other
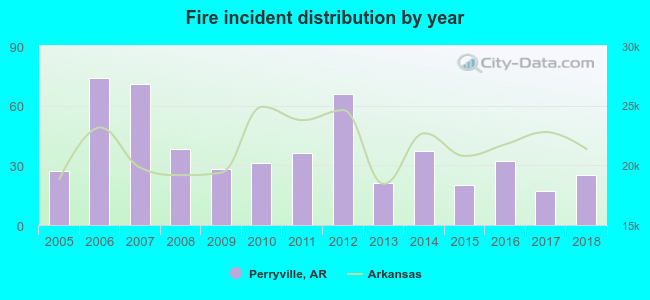 According to the data from the years 2005 - 2018 the average number of fire incidents per year is 37. The highest number of reported fires - 74 took place in 2006, and the least - 17 in 2017. The data has a declining trend.
 The median response time based on all reported fire incidents is 8 minutes. This is higher compared to the state median value.
The median response time in Perryville, AR compared to nearest cities:
(Note: Based on data for all years, including only cities with at least 500 fire incidents)
| Perryville: | 8 minutes |
| Morrilton: | 7 minutes |
| Atkins: | 10 minutes |
| Conway: | 5 minutes |
| Pottsville: | 9 minutes |
| Mayflower: | 11 minutes |
| Maumelle: | 3 minutes |
| Russellville: | 5 minutes |
| Greenbrier: | 7 minutes |
 29.4% incidents where reported in the morning and 70.6% in the evening. The most fires (20.0%) took place on Saturday, and the least (11.1%) on Friday.
 According to the 524 fire incidents from years 2005 - 2018 most fires (16.4%) took place during January, and the least (4.6%) in December.
 Out of all 826 cases reported during the years 2005 - 2018, the most belonged to the categories: Fire (63.4%), Overpressure Rupture (23.0%), and Rescue & EMS (6.8%).
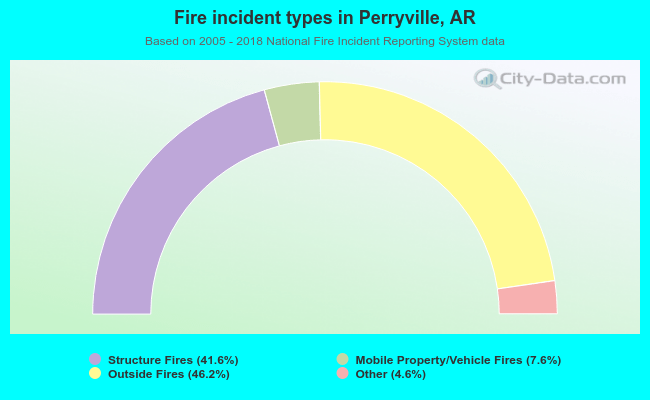 When looking into fire subcategories, the most incidents belonged to: Outside Fires (46.2%), and Structure Fires (41.6%).