| Fire incidents reported |
|---|
| Sreet name | Count |
|---|
| 2269 BRONCO RD | 18 | | 753 RD 22 | 8 | | HWY 166 | 8 | | 350 RD 22 | 6 | | 402 N PINE | 6 | | RD 22 BRONCO | 6 | | 107 N MERCHANT | 4 | | 220 RD 22 | 4 | | 2397 INDIAN RD | 4 | | 2640 GALLOP RD | 4 | | 301 RD 22 | 4 | | 328 RD 22 | 4 | | 360 RD 22 | 4 | | 701 S GRANT ST | 4 | | BRONCO RD 22 | 4 | | COWBOY AND RD 22 | 4 | | EAGLE RD | 4 | | HWY 166 AND GALLOP RD | 4 | | HWY 166 AND RD 21 | 4 | | HWY 166 RD 22 | 4 | | RD 22 AND BRONCO | 4 | | RD 23 AND COWBOY | 4 | | RD 23 COWBOY | 4 | | RD 24 AND COWBOY | 4 | | RD 25 | 4 |
| | | Fire incidents reported |
|---|
| Sreet name | Count |
|---|
| RD 25 AND DALTON | 4 | | RD 26 AND INDIAN RD | 4 | | 1 BLOCK NORTH OF FLAG POLE | 2 | | 1 MILE S OF 166 ON RD 21 | 2 | | 1 MILE S OF HWY166 ON RD 21 | 2 | | 101 S MERCHANT STREET | 2 | | 166 AND RD 21 | 2 | | 166 HWY | 2 | | 1934 RD 27 | 2 | | 2 MILES NORTH OF PERU | 2 | | 2064 HWY 166 | 2 | | 2085 HERITAGE RD | 2 | | 2144 HIGHWAY 166 | 2 | | 2144 HWY 166 | 2 | | 22 BRONCO | 2 | | 220 RD22 | 2 | | 221 RD 23 | 2 | | 2211 COWBOY RD | 2 | | 2248 BRONCO RD | 2 | | 2280 INDIAN RD | 2 | | 2287 COWBOY RD | 2 | | 2299 DALTON | 2 | | 2299 DALTON ROAD | 2 | | 2300 INDIAN RD | 2 | | |
|
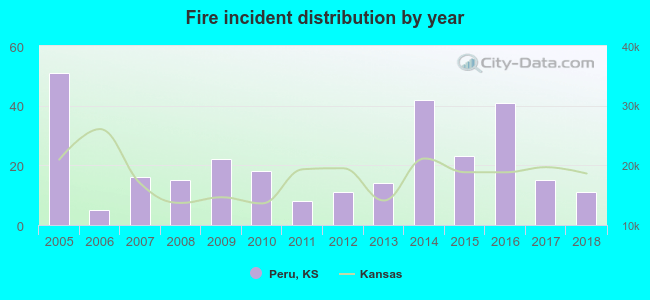 Based on the data from the years 2005 - 2018 the average number of fire incidents per year is 21. The highest number of reported fire incidents - 51 took place in 2005, and the least - 5 in 2006. The data has a dropping trend.
 19.5% incidents where reported in the morning and 80.5% in the evening. The most fires (18.8%) took place on Saturday, and the least (11.0%) on Thursday.
 According to the 292 incident reports from years 2005 - 2018 most fires (40.1%) took place during March, and the least (0.0%) in May.
 Out of all 301 cases reported during the years 2005 - 2018, the most belonged to the categories: Fire (97.0%), Hazardous Condition (1.3%), and Rescue & EMS (1.0%).
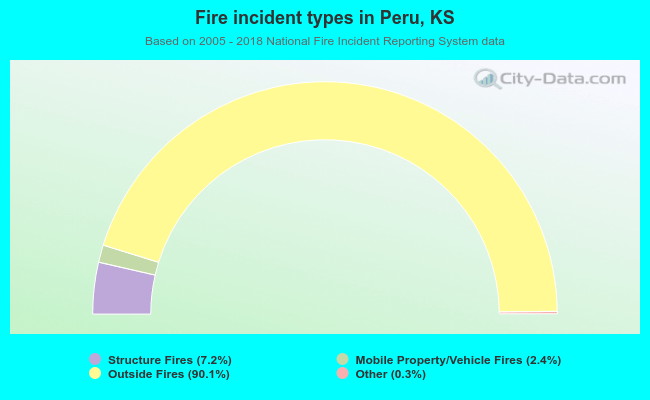 When looking into fire subcategories, the most reports belonged to: Outside Fires (90.1%), and Structure Fires (7.2%).