Pevely: Fire Incidents, Missouri (MO)
Where are fire incidents reported in Pevely, MO
Something went wrong! Please refresh the page.
|
| |||||||||||||||||||||||||||||||||||||||||||||||||||||||||||||||||||||||||||||||||||||||||||||||||||||||||||||
| Other | 155 | |||||||||||||||||||||||||||||||||||||||||||||||||||||||||||||||||||||||||||||||||||||||||||||||||||||||||||||
2002 - 2018 National Fire Incident Reporting System (NFIRS) incidents
- Incident types reported to NFIRS in Pevely, MO
- 3,78063.5%Rescue & EMS
- 5659.5%Fire
- 5318.9%Service Call
- 5078.5%Hazardous Condition
- 3185.3%Good Intent Call
- 2434.1%False Alarm
- 80.1%Overpressure Rupture
- Fire incident types reported to NFIRS in Pevely, MO
- 30954.7%Structure Fires
- 12822.7%Outside Fires
- 10017.7%Mobile Property/Vehicle Fires
- 285.0%Other
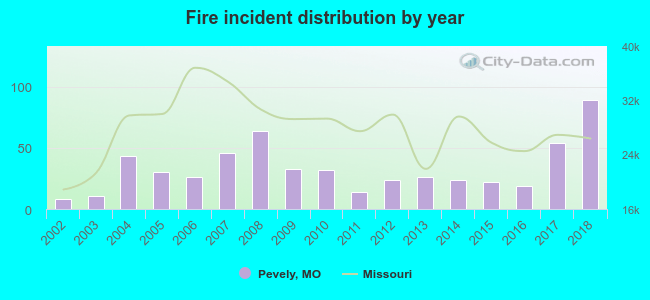 According to the data from the years 2002 - 2018 the average number of fires per year is 33. The highest number of fires - 89 took place in 2018, and the least - 8 in 2002. The data has a growing trend.
The average number of yearly fire incidents per 10k residents in Pevely, MO compared to nearest cities:
(Note: Based on data for the last 3 years, including only cities with population 5,000 and above)
| Pevely: | 96.1 |
| Barnhart: | 87.4 |
| Festus: | 169.4 |
| Arnold: | 17.4 |
| Oakville: | 0.3 |
| De Soto: | 178.2 |
| Mehlville: | 1.2 |
| Sunset Hills: | 39.5 |
| Lemay: | 10.8 |
 The median response time based on all reported fire incidents is 6 minutes. This is about the same as the Missouri median value.
The median response time in Pevely, MO compared to nearest cities:
(Note: Based on data for all years, including only cities with at least 500 fire incidents)
| Pevely: | 6 minutes |
| Barnhart: | 8 minutes |
| Festus: | 9 minutes |
| Imperial: | 7 minutes |
| Hillsboro: | 10 minutes |
| Arnold: | 6 minutes |
| De Soto: | 10 minutes |
| Waterloo: | 8 minutes |
| Cedar Hill: | 7 minutes |
 35.9% incidents where reported in the morning and 64.1% in the evening. The most fires (18.2%) took place on Wednesday, and the least (12.2%) on Monday.
 According to the 565 incident reports from years 2002 - 2018 most fires (12.2%) took place during January, and the least (3.7%) in October.
 Out of all 5,956 cases reported during the years 2002 - 2018, the most belonged to the categories: Rescue & EMS (63.5%), Fire (9.5%), and Service Call (8.9%).
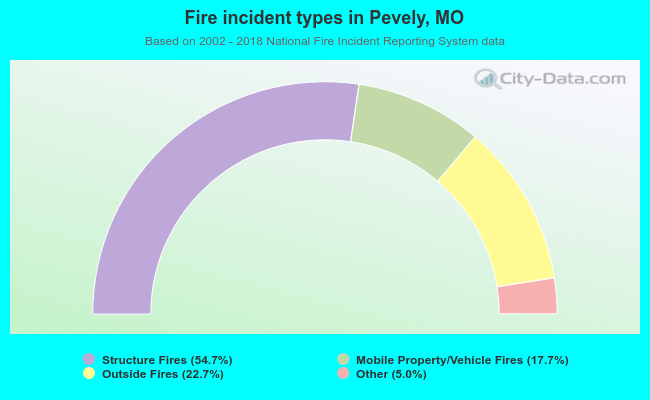 When looking into fire subcategories, the most reports belonged to: Structure Fires (54.7%), and Outside Fires (22.7%).