| Fire incidents reported |
|---|
| Sreet name | Count |
|---|
| US ROUTE 11 | 22 | | ELMRIDGE ROAD | 12 | | SAND STREET | 10 | | QUAKER AVE | 8 | | STATE ROUTE 26 | 6 | | 17 SAND ST | 4 | | CO. RT. 20 | 4 | | COUNTY ROUTE 28 | 4 | | COUNTY ROUTE 29 | 4 | | EAGLE AVE | 4 | | ELM RIDGE ROAD | 4 | | ELM RIDGE ROAD RD | 4 | | GARDEN OF EDEN ROAD | 4 | | MAIN STREET | 4 | | NYS RT 26 | 4 | | OREBED ROAD | 4 | | SANDYHOLLOW ROAD | 4 | | US. RT. 11 | 4 | | 17 SANDS STREET | 2 | | 24 CLARK ST | 2 | | 3 S. MAIN ST. | 2 | | 30658 CT. RT. 20 | 2 | | 30689 CT RT 20 | 2 | | 30959 CT. RT. 30 | 2 | | 31383 TOWN LINE RD. | 2 |
| | | Fire incidents reported |
|---|
| Sreet name | Count |
|---|
| 31617 US. RT. 11 | 2 | | 317 QUACKER AVE. | 2 | | 31817 COUNTY RT 30 | 2 | | 32573 US. RT. 11 | 2 | | 32573 US.RT11 | 2 | | 32677 ELM RIDGE RD. | 2 | | 32939 US. RT. 11 | 2 | | 333 QUAKER AVE. | 2 | | 33700 GARDEN OF EDEN RD | 2 | | 34038 ELM RIDGE RD | 2 | | 35084 CT. RT. 28 | 2 | | 36777 CT. RT.28 | 2 | | 37674 OREBED RD. | 2 | | 37769 ORE BED RD. | 2 | | BLEAM RD. | 2 | | BLEAM ROAD | 2 | | CHURCH STREET | 2 | | CLARK ST. | 2 | | CLARK STREET | 2 | | CO RT 20 | 2 | | COUNTY ROUTE 20 | 2 | | CT RT 20 | 2 | | CT. RT. 20 | 2 | | DEPOT STREET | 2 | | ELM RIDGE RD. | 2 |
|
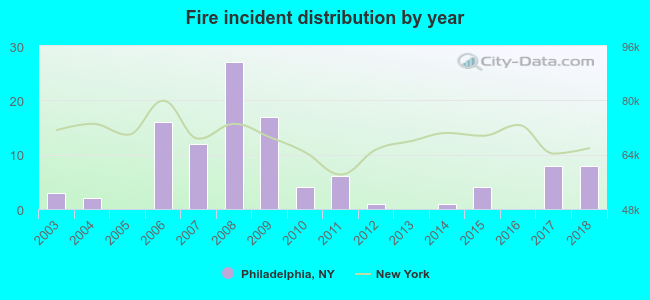 According to the data from the years 2003 - 2018 the average number of fire incidents per year is 7. The highest number of reported fire incidents - 27 took place in 2008, and the least - 0 in 2005. The data has a rising trend.
 33.0% incidents where reported in the morning and 67.0% in the evening. The most fires (23.9%) took place on Sunday, and the least (8.3%) on Thursday.
 Based on the 109 fires from years 2003 - 2018 most fires (20.2%) took place during March, and the least (0.9%) in February.
 Out of all 474 cases reported during the years 2003 - 2018, the most belonged to the categories: Hazardous Condition (25.1%), Fire (23.0%), and Good Intent Call (19.4%).
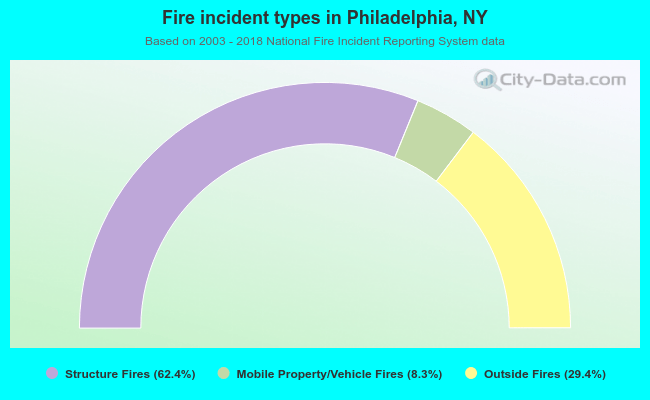 When looking into fire subcategories, the most incidents belonged to: Structure Fires (62.4%), and Outside Fires (29.4%).