Phoenixville: Fire Incidents, Pennsylvania (PA)
Where are fire incidents reported in Phoenixville, PA
Something went wrong! Please refresh the page.
| Fire incidents reported | |
|---|---|
| Sreet name | Count |
| HIGH ST | 354 |
| BRIDGE ST | 294 |
| NUTT RD | 182 |
| MAIN ST | 136 |
| SCHUYLKILL RD | 102 |
| CHURCH ST | 74 |
| KIMBERTON RD | 68 |
| GAY ST | 42 |
| RAILROAD ST | 42 |
| WASHINGTON AV | 38 |
| MORGAN ST | 36 |
| WHEATLAND ST | 36 |
| EMMETT ST | 34 |
| HALL ST | 34 |
| PROSPECT ST | 34 |
| SEVEN STARS RD | 34 |
| FIRST AV | 32 |
| RIDGE RD | 32 |
| SOUTH ST | 32 |
| DAYTON ST | 30 |
| GROVER ST | 30 |
| RAPPS DAM RD | 30 |
| STARR ST | 30 |
| SAINT MARYS ST | 26 |
| TOWNSHIP LINE RD | 26 |
| CHERRY ST | 24 |
| PARADISE ST | 24 |
| WALNUT ST | 24 |
| CHARLESTOWN RD | 20 |
| COLDSTREAM RD | 20 |
2003 - 2018 National Fire Incident Reporting System (NFIRS) incidents
- Incident types reported to NFIRS in Phoenixville, PA
- 1,96328.5%Hazardous Condition
- 1,86027.0%Fire
- 1,05515.3%False Alarm
- 1,03315.0%Rescue & EMS
- 4646.7%Good Intent Call
- 3845.6%Service Call
- 1151.7%Special Incident
- Fire incident types reported to NFIRS in Phoenixville, PA
- 1,25567.5%Structure Fires
- 39821.4%Outside Fires
- 1065.7%Other
- 1015.4%Mobile Property/Vehicle Fires
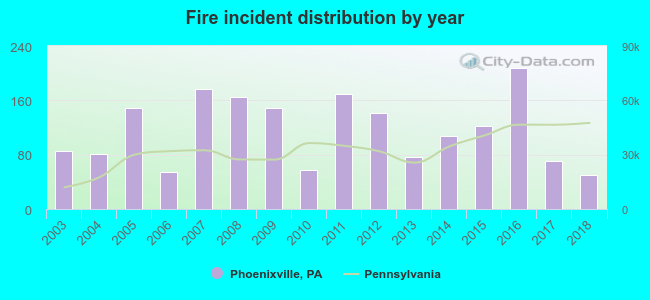 According to the data from the years 2003 - 2018 the average number of fire incidents per year is 116. The highest number of reported fires - 207 took place in 2016, and the least - 50 in 2018. The data has a declining trend.
The average number of yearly fire incidents per 10k residents in Phoenixville, PA compared to nearest cities:
(Note: Based on data for the last 3 years, including only cities with population 5,000 and above)
| Phoenixville: | 65.7 |
| Audubon: | 30.8 |
| Collegeville: | 88.9 |
| Paoli: | 18.5 |
| Trooper: | 7.5 |
| West Norriton: | 4.1 |
| King of Prussia: | 82.4 |
| Norristown: | 98.0 |
| East Norriton: | 30.3 |
 The median response time based on all reported fire incidents is 6 minutes. This is similar to the state median value.
The median response time in Phoenixville, PA compared to nearest cities:
(Note: Based on data for all years, including only cities with at least 500 fire incidents)
| Phoenixville: | 6 minutes |
| Spring City: | 6 minutes |
| Malvern: | 9 minutes |
| Berwyn: | 8 minutes |
| King of Prussia: | 8 minutes |
| Exton: | 6 minutes |
| Norristown: | 4 minutes |
| Pottstown: | 6 minutes |
| Conshohocken: | 5 minutes |
 According to the reports from the years 2003 - 2018 the average number of fire-related yearly casualties is 2. The highest number of casualties - 12 took place in 2008, and the lowest - 0 in 2005. The data has a decreasing trend.
The average number of injuries per 1,000 fires is 13. This indicator was the highest - 73 in 2008, and the lowest 0 in 2005. The trend for casualties per 1,000 fire incidents is decreasing. Compared to the Pennsylvania value the number of injuries per 1,000 fire incidents is much higher.
According to the reports from the years 2003 - 2018 the average number of fire-related yearly casualties is 2. The highest number of casualties - 12 took place in 2008, and the lowest - 0 in 2005. The data has a decreasing trend.
The average number of injuries per 1,000 fires is 13. This indicator was the highest - 73 in 2008, and the lowest 0 in 2005. The trend for casualties per 1,000 fire incidents is decreasing. Compared to the Pennsylvania value the number of injuries per 1,000 fire incidents is much higher.Casualties per 1,000 incidents in Phoenixville, PA compared to nearest cities:
(Note: Based on data for all years, including only cities with at least 500 fire incidents)
| Phoenixville: | 14.0 |
| Spring City: | 1.6 |
| Malvern: | 7.7 |
| Berwyn: | 1.7 |
| King of Prussia: | 2.0 |
| Exton: | 7.9 |
| Norristown: | 13.5 |
| Pottstown: | 10.6 |
| Conshohocken: | 6.0 |
 31.9% incidents where reported in the morning and 68.1% in the evening. The most fires (17.5%) took place on Sunday, and the least (10.6%) on Thursday.
 Based on the 1,860 fires from years 2003 - 2018 most fires (11.3%) took place during January, and the least (5.6%) in September.
 Out of all 6,885 cases reported during the years 2003 - 2018, the most belonged to the categories: Hazardous Condition (28.5%), Fire (27.0%), and False Alarm (15.3%).
 When looking into fire subcategories, the most reports belonged to: Structure Fires (67.5%), and Outside Fires (21.4%).