Pierre Part: Fire Incidents, Louisiana (LA)
Where are fire incidents reported in Pierre Part, LA
Something went wrong! Please refresh the page.
|
| |||||||||||||||||||||||||||||||||||||||||||||||||||||||||||||||||||||||||||||||||||||||||||||||||||||||||||||
2002 - 2018 National Fire Incident Reporting System (NFIRS) incidents
- Incident types reported to NFIRS in Pierre Part, LA
- 15875.6%Fire
- 2612.4%Hazardous Condition
- 136.2%False Alarm
- 115.3%Service Call
- 10.5%Good Intent Call
- Fire incident types reported to NFIRS in Pierre Part, LA
- 6239.2%Structure Fires
- 4427.8%Outside Fires
- 3320.9%Mobile Property/Vehicle Fires
- 1912.0%Other
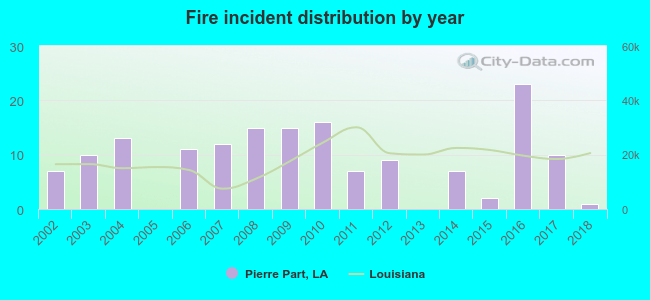 According to the data from the years 2002 - 2018 the average number of fire incidents per year is 9. The highest number of fire incidents - 23 took place in 2016, and the least - 0 in 2005. The data has a declining trend.
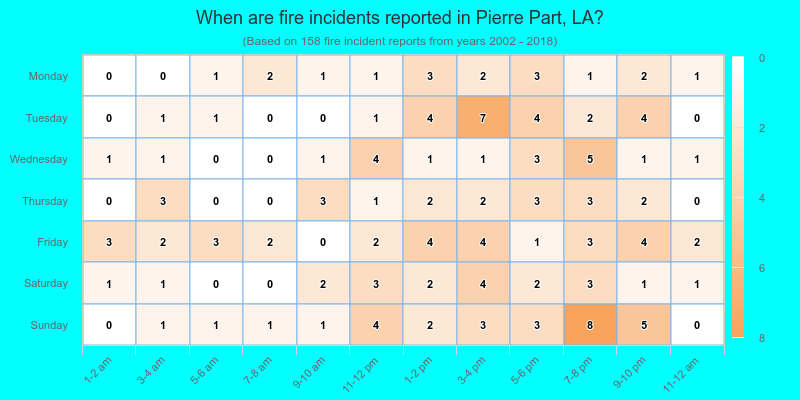
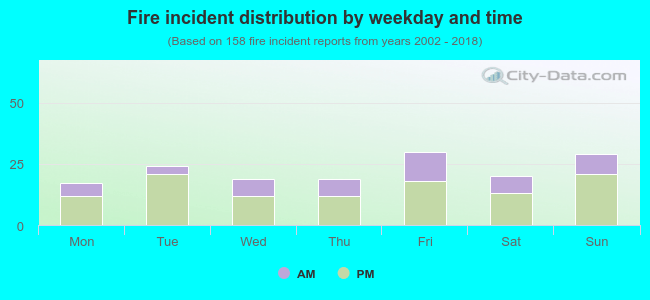 31.0% incidents where reported in the morning and 69.0% in the evening. The most fires (19.0%) took place on Friday, and the least (10.8%) on Monday.
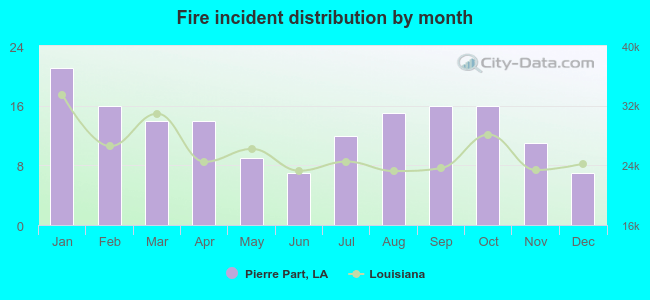 Based on the 158 fire incident reports from years 2002 - 2018 most fires (13.3%) took place during January, and the least (4.4%) in June.
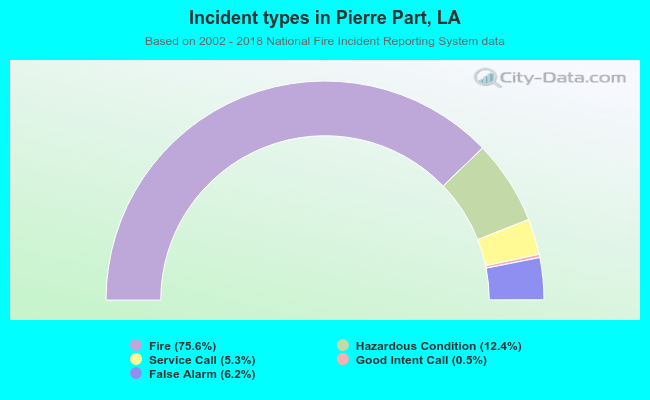 Out of all 209 cases reported during the years 2002 - 2018, the most belonged to the categories: Fire (75.6%), Overpressure Rupture (12.4%), and Service Call (6.2%).
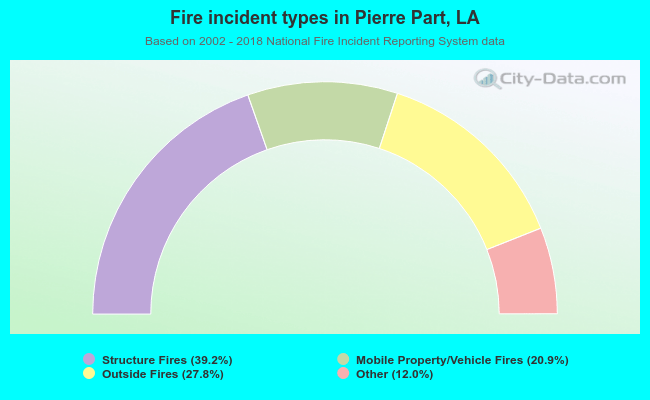 When looking into fire subcategories, the most reports belonged to: Structure Fires (39.2%), and Outside Fires (27.8%).