Piqua: Fire Incidents, Ohio (OH)
Where are fire incidents reported in Piqua, OH
Something went wrong! Please refresh the page.
| Fire incidents reported | |
|---|---|
| Sreet name | Count |
| MAIN ST | 64 |
| COVINGTON AVE | 42 |
| ASH | 38 |
| I75 | 32 |
| US RT 36 | 32 |
| COVINGTON AVEN | 30 |
| HARDIN RD | 30 |
| SOUTH ST | 30 |
| 1ST ST | 28 |
| PARK AVE | 26 |
| COUNTY RD 25A | 22 |
| HETZLER RD | 22 |
| SNODGRASS RD | 22 |
| ASH ST | 20 |
| MAIN ST. | 20 |
| STATLER RD | 20 |
| WATER ST | 20 |
| BROADWAY | 18 |
| COUNTY ROAD 25A RD | 18 |
| DOWNING ST | 18 |
| MAIN | 18 |
| WAYNE ST | 18 |
| ASH E | 16 |
| COUNTY ROAD 25A | 16 |
| COVINGTON AVE. | 16 |
| FESSLER BUXTON RD | 16 |
| BROWN RD | 14 |
| CAMP ST | 14 |
| COVINGTON | 14 |
| GARBRY RD | 14 |
| Other | 704 |
2004 - 2018 National Fire Incident Reporting System (NFIRS) incidents
- Incident types reported to NFIRS in Piqua, OH
- 1,41229.1%Fire
- 1,16824.1%Good Intent Call
- 1,06221.9%Hazardous Condition
- 56411.6%Rescue & EMS
- 4098.4%False Alarm
- 2174.5%Service Call
- 80.2%Overpressure Rupture
- 50.1%Special Incident
- Fire incident types reported to NFIRS in Piqua, OH
- 60642.9%Outside Fires
- 54338.5%Structure Fires
- 26318.6%Mobile Property/Vehicle Fires
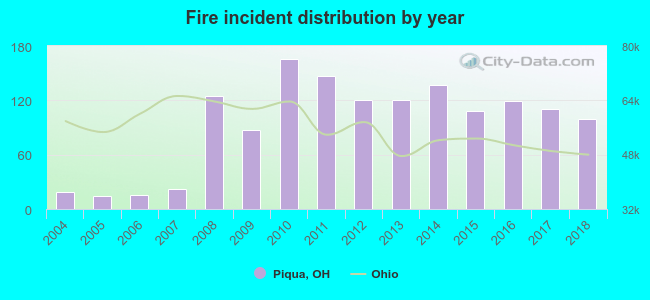 According to the data from the years 2004 - 2018 the average number of fires per year is 94. The highest number of fires - 166 took place in 2010, and the least - 14 in 2005. The data has a growing trend.
The average number of yearly fire incidents per 10k residents in Piqua, OH compared to nearest cities:
(Note: Based on data for the last 3 years, including only cities with population 5,000 and above)
| Piqua: | 52.7 |
| Troy: | 30.9 |
| Sidney: | 71.9 |
| Tipp City: | 55.5 |
| Union: | 18.8 |
| New Carlisle: | 93.9 |
| Vandalia: | 55.9 |
| Englewood: | 42.9 |
| Greenville: | 75.4 |
 The median response time based on all reported fire incidents is 8 minutes. This is higher than the Ohio median value.
The median response time in Piqua, OH compared to nearest cities:
(Note: Based on data for all years, including only cities with at least 500 fire incidents)
| Piqua: | 8 minutes |
| Troy: | 7 minutes |
| Sidney: | 8 minutes |
| Tipp City: | 10 minutes |
| Anna: | 9 minutes |
| New Carlisle: | 8 minutes |
| Vandalia: | 6 minutes |
| Arcanum: | 10 minutes |
| Englewood: | 5 minutes |
 According to the data from the years 2004 - 2018 the average number of fire-related yearly casualties is 1. The highest number of reported casualties - 5 took place in 2013, and the lowest - 0 in 2004. The data has an increasing trend.
The average number of injuries per 1,000 fire incidents is 9. This indicator was the highest - 42 in 2013, and the lowest 0 in 2004. The trend for injuries per 1,000 fires is rising. Compared to the Ohio value the number of casualties per 1,000 fires is about the same.
According to the data from the years 2004 - 2018 the average number of fire-related yearly casualties is 1. The highest number of reported casualties - 5 took place in 2013, and the lowest - 0 in 2004. The data has an increasing trend.
The average number of injuries per 1,000 fire incidents is 9. This indicator was the highest - 42 in 2013, and the lowest 0 in 2004. The trend for injuries per 1,000 fires is rising. Compared to the Ohio value the number of casualties per 1,000 fires is about the same.
 28.2% incidents where reported in the morning and 71.8% in the evening. The most fires (16.1%) took place on Sunday, and the least (12.1%) on Thursday.
 According to the 1,412 fire incident reports from years 2004 - 2018 most fires (10.3%) took place during May, and the least (5.5%) in February.
 Out of all 4,846 cases reported during the years 2004 - 2018, the most belonged to the categories: Fire (29.1%), Good Intent Call (24.1%), and Hazardous Condition (21.9%).
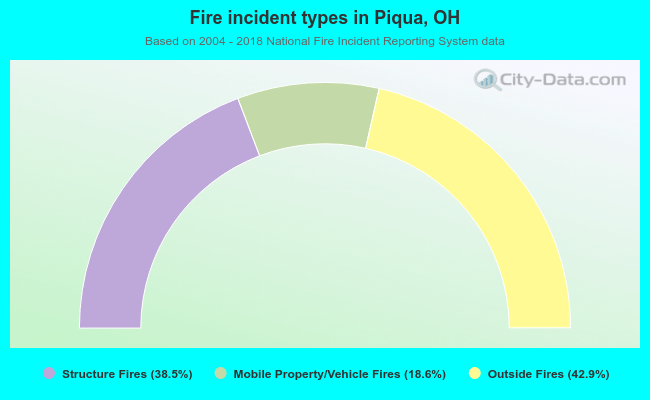 When looking into fire subcategories, the most reports belonged to: Outside Fires (42.9%), and Structure Fires (38.5%).