Plainville: Fire Incidents, Massachusetts (MA)
Where are fire incidents reported in Plainville, MA
Something went wrong! Please refresh the page.
| Fire incidents reported | |
|---|---|
| Sreet name | Count |
| WASHINGTON ST | 120 |
| MESSENGER ST | 104 |
| TAUNTON ST | 96 |
| SOUTH ST | 78 |
| TAUNTON STREET | 74 |
| WASHINGTON STREET | 70 |
| BACON ST | 66 |
| SOUTH STREET | 60 |
| MESSENGER STREET | 50 |
| EAST BACON STREET | 30 |
| HIGH ST | 28 |
| WARREN STREET | 24 |
| CROSS ST | 22 |
| SCHOOL ST | 22 |
| OLD TAUNTON ST | 18 |
| COWELL ST | 16 |
| GEORGE ST | 14 |
| HIGH STREET | 14 |
| WALNUT ST | 14 |
| WEST BACON STREET | 14 |
| WILKINS DR | 14 |
| LEGION DR | 12 |
| MIRIMICHI ST | 12 |
| BELCHER ST | 10 |
| BOW ST | 10 |
| FALES RD | 10 |
| GREEN ST | 10 |
| LINCOLN AVE | 10 |
| MAN MAR DR | 10 |
| MAPLE ST | 10 |
2002 - 2018 National Fire Incident Reporting System (NFIRS) incidents
- Incident types reported to NFIRS in Plainville, MA
- 4,98835.5%Rescue & EMS
- 3,81227.1%Special Incident
- 1,60911.4%Service Call
- 1,2268.7%Hazardous Condition
- 9777.0%False Alarm
- 9266.6%Fire
- 3692.6%Good Intent Call
- 1270.9%Severe Weather
- 210.1%Overpressure Rupture
- Fire incident types reported to NFIRS in Plainville, MA
- 38541.6%Other
- 25527.5%Structure Fires
- 21623.3%Outside Fires
- 707.6%Mobile Property/Vehicle Fires
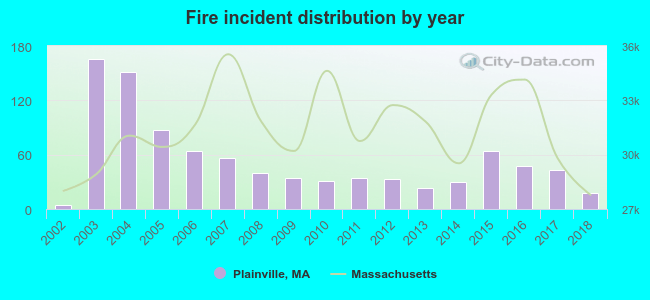 According to the data from the years 2002 - 2018 the average number of fire incidents per year is 54. The highest number of reported fire incidents - 166 took place in 2003, and the least - 4 in 2002. The data has an increasing trend.
The average number of yearly fire incidents per 10k residents in Plainville, MA compared to nearest cities:
(Note: Based on data for the last 3 years, including only cities with population 5,000 and above)
| Plainville: | 44.0 |
| Wrentham: | 20.1 |
| Foxborough: | 96.0 |
| Mansfield: | 27.7 |
| Attleboro: | 27.7 |
| Franklin: | 22.5 |
| Norfolk: | 60.0 |
| Norton: | 20.0 |
| Walpole: | 123.4 |
 The median response time based on all reported fire incidents is 4 minutes. This is comparable to the Massachusetts median value.
The median response time in Plainville, MA compared to nearest cities:
(Note: Based on data for all years, including only cities with at least 500 fire incidents)
| Plainville: | 4 minutes |
| Wrentham: | 2 minutes |
| Foxborough: | 5 minutes |
| Mansfield: | 5 minutes |
| Attleboro: | 4 minutes |
| Franklin: | 6 minutes |
| Norfolk: | 3 minutes |
| Norton: | 4 minutes |
| Walpole: | 3 minutes |
 Based on the data from the years 2002 - 2018 the average number of fire-related casualties per year is 0. The highest number of reported casualties - 2 took place in 2007, and the lowest - 0 in 2002. The data has a constant trend.
The average number of casualties per 1,000 fire incidents is 10. This indicator was the highest - 65 in 2010, and the lowest 0 in 2002. The trend for casualties per 1,000 fire incidents is constant. Compared to the state value the number of injuries per 1,000 fires is lower.
Based on the data from the years 2002 - 2018 the average number of fire-related casualties per year is 0. The highest number of reported casualties - 2 took place in 2007, and the lowest - 0 in 2002. The data has a constant trend.
The average number of casualties per 1,000 fire incidents is 10. This indicator was the highest - 65 in 2010, and the lowest 0 in 2002. The trend for casualties per 1,000 fire incidents is constant. Compared to the state value the number of injuries per 1,000 fires is lower.
 36.1% incidents where reported in the morning and 63.9% in the evening. The most fires (18.1%) took place on Friday, and the least (10.0%) on Sunday.
 According to the 926 fire incidents from years 2002 - 2018 most fires (12.6%) took place during April, and the least (4.3%) in November.
 Out of all 14,055 cases reported during the years 2002 - 2018, the most belonged to the categories: Rescue & EMS (35.5%), Special Incident (27.1%), and Service Call (11.4%).
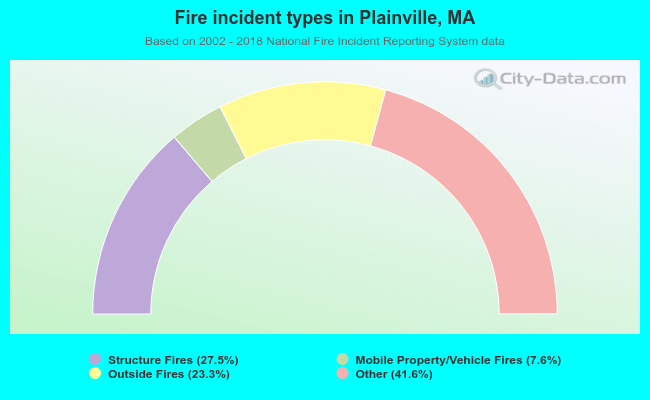 When looking into fire subcategories, the most incidents belonged to: Other (41.6%), and Structure Fires (27.5%).