Plaistow: Fire Incidents, New Hampshire (NH)
Where are fire incidents reported in Plaistow, NH
Something went wrong! Please refresh the page.
|
| |||||||||||||||||||||||||||||||||||||||||||||||||||||||||||||||||||||||||||||||||||||||||||||||||||||||||||||
2003 - 2018 National Fire Incident Reporting System (NFIRS) incidents
- Incident types reported to NFIRS in Plaistow, NH
- 3,20959.6%Rescue & EMS
- 68512.7%False Alarm
- 4778.9%Service Call
- 4578.5%Fire
- 3726.9%Hazardous Condition
- 1763.3%Good Intent Call
- Fire incident types reported to NFIRS in Plaistow, NH
- 20544.9%Outside Fires
- 15934.8%Structure Fires
- 7015.3%Mobile Property/Vehicle Fires
- 235.0%Other
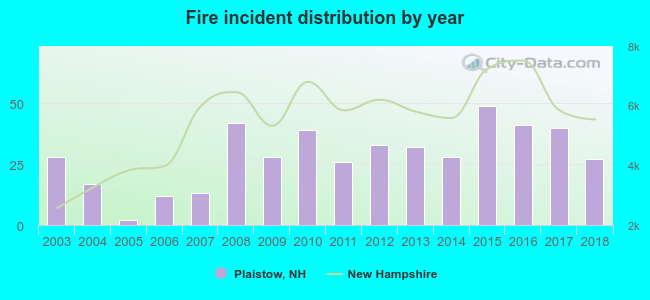 Based on the data from the years 2003 - 2018 the average number of fire incidents per year is 29. The highest number of reported fire incidents - 49 took place in 2015, and the least - 2 in 2005. The data has a declining trend.
The average number of yearly fire incidents per 10k residents in Plaistow, NH compared to nearest cities:
(Note: Based on data for the last 3 years, including only cities with population 5,000 and above)
| Plaistow: | 47.3 |
| Atkinson: | 17.3 |
| Hampstead: | 26.2 |
| Kingston: | 52.6 |
| Salem: | 38.0 |
| Sandown: | 25.1 |
| Windham: | 29.7 |
| Derry: | 46.6 |
| Exeter: | 59.2 |
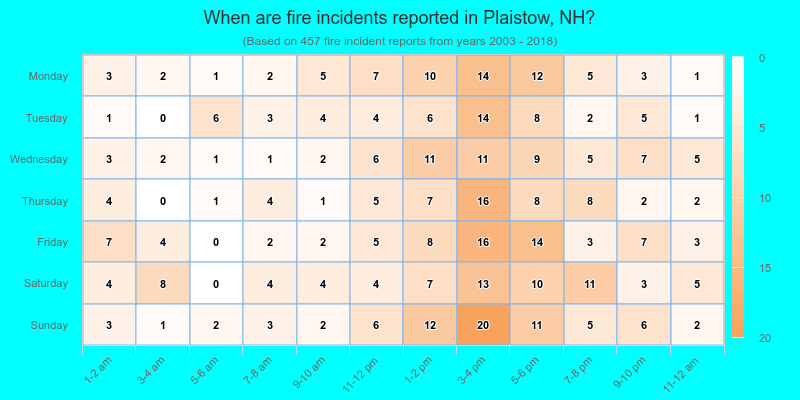
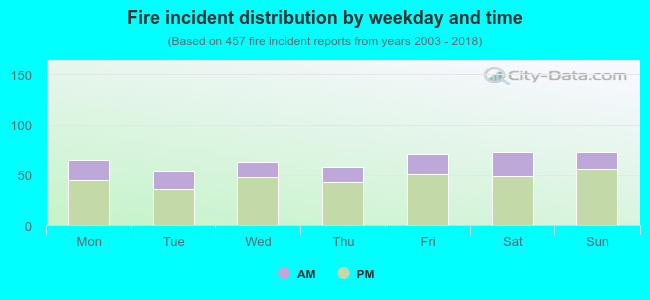 28.2% incidents where reported in the morning and 71.8% in the evening. The most fires (16.0%) took place on Saturday, and the least (11.8%) on Tuesday.
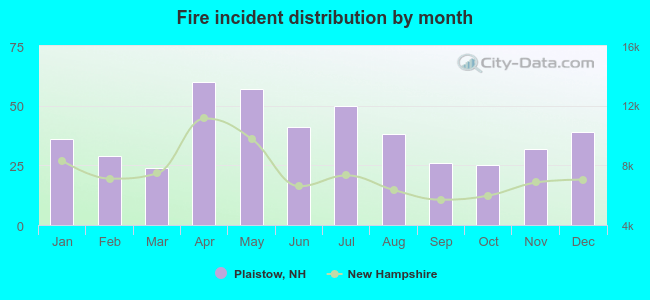 According to the 457 reports from years 2003 - 2018 most fires (13.1%) took place during April, and the least (5.3%) in March.
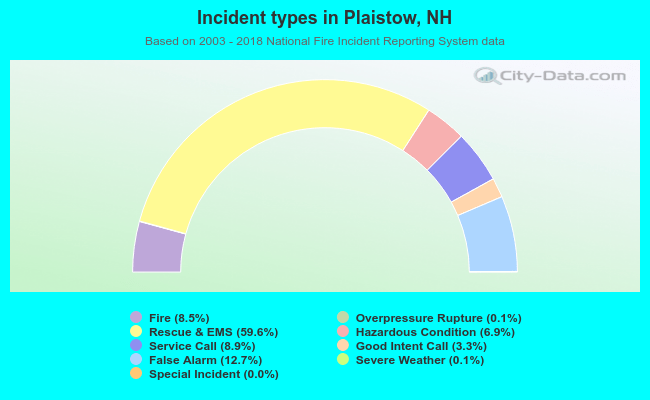 Out of all 5,384 cases reported during the years 2003 - 2018, the most belonged to the categories: Rescue & EMS (59.6%), False Alarm (12.7%), and Service Call (8.9%).
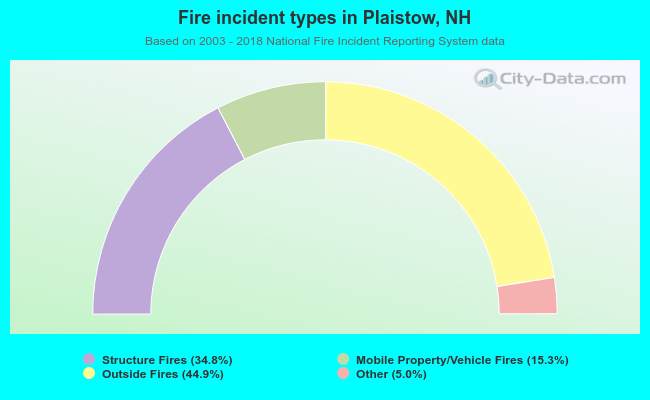 When looking into fire subcategories, the most reports belonged to: Outside Fires (44.9%), and Structure Fires (34.8%).