Platteville: Fire Incidents, Wisconsin (WI)
Where are fire incidents reported in Platteville, WI
Something went wrong! Please refresh the page.
|
| |||||||||||||||||||||||||||||||||||||||||||||||||||||||||||||||||||||||||||||||||||||||||||||||||||||||||||||
| Other | 27 | |||||||||||||||||||||||||||||||||||||||||||||||||||||||||||||||||||||||||||||||||||||||||||||||||||||||||||||
2003 - 2018 National Fire Incident Reporting System (NFIRS) incidents
- Incident types reported to NFIRS in Platteville, WI
- 29330.8%Fire
- 22123.2%False Alarm
- 15616.4%Rescue & EMS
- 12813.4%Hazardous Condition
- 636.6%Good Intent Call
- 515.4%Service Call
- 353.7%Severe Weather
- 40.4%Overpressure Rupture
- 10.1%Special Incident
- Fire incident types reported to NFIRS in Platteville, WI
- 14047.8%Structure Fires
- 6622.5%Outside Fires
- 5920.1%Mobile Property/Vehicle Fires
- 289.6%Other
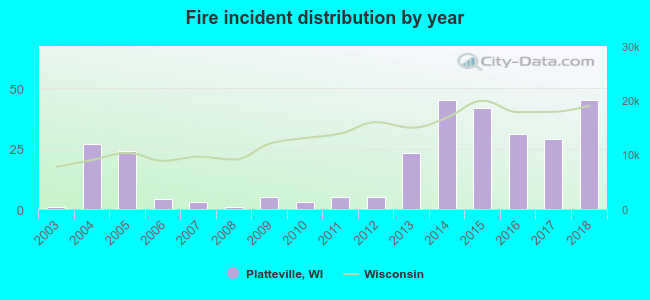 Based on the data from the years 2003 - 2018 the average number of fire incidents per year is 18. The highest number of fire incidents - 45 took place in 2014, and the least - 1 in 2003. The data has an increasing trend.
The average number of yearly fire incidents per 10k residents in Platteville, WI compared to nearest cities:
(Note: Based on data for the last 3 years, including only cities with population 5,000 and above)
| Platteville: | 28.5 |

 30.0% incidents where reported in the morning and 70.0% in the evening. The most fires (21.5%) took place on Saturday, and the least (9.9%) on Thursday.
 According to the 293 fire incidents from years 2003 - 2018 most fires (15.7%) took place during April, and the least (2.4%) in December.
 Out of all 952 cases reported during the years 2003 - 2018, the most belonged to the categories: Fire (30.8%), False Alarm (23.2%), and Rescue & EMS (16.4%).
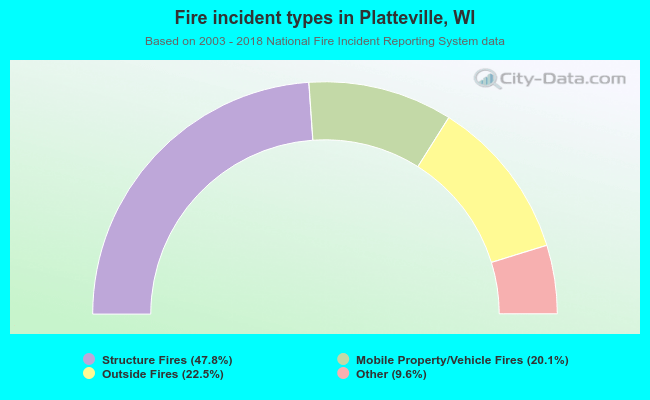 When looking into fire subcategories, the most incidents belonged to: Structure Fires (47.8%), and Outside Fires (22.5%).